Markets
Which Countries Hold the Most U.S. Debt?


Which Countries Hold the Most U.S. Debt in 2022?
Today, America owes foreign investors of its national debt $7.3 trillion.
These are in the form of Treasury securities, some of the most liquid assets worldwide. Central banks use them for foreign exchange reserves and private investors flock to them during flights to safety thanks to their perceived low default risk.
Beyond these reasons, foreign investors may buy Treasuries as a store of value. They are often used as collateral during certain international trade transactions, or countries can use them to help manage exchange rate policy. For example, countries may buy Treasuries to protect their currency’s exchange rate from speculation.
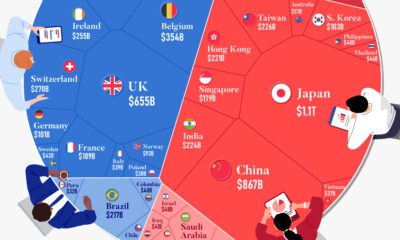
In the above graphic, we show the foreign holders of the U.S. national debt using data from the U.S. Department of the Treasury.
Top Foreign Holders of U.S. Debt
With $1.1 trillion in Treasury holdings, Japan is the largest foreign holder of U.S. debt.
Japan surpassed China as the top holder in 2019 as China shed over $250 billion, or 30% of its holdings in four years.
This bond offloading by China is the one way the country can manage the yuan’s exchange rate. This is because if it sells dollars, it can buy the yuan when the currency falls. At the same time, China doesn’t solely use the dollar to manage its currency—it now uses a basket of currencies.
Here are the countries that hold the most U.S. debt:
| Rank | Country | U.S. Treasury Holdings | Share of Total |
|---|---|---|---|
| 1 | 🇯🇵 Japan | $1,076B | 14.7% |
| 2 | 🇨🇳 China | $867B | 11.9% |
| 3 | 🇬🇧 United Kingdom | $655B | 8.9% |
| 4 | 🇧🇪 Belgium | $354B | 4.8% |
| 5 | 🇱🇺 Luxembourg | $329B | 4.5% |
| 6 | 🇰🇾 Cayman Islands | $284B | 3.9% |
| 7 | 🇨🇭 Switzerland | $270B | 3.7% |
| 8 | 🇮🇪 Ireland | $255B | 3.5% |
| 9 | 🇹🇼 Taiwan | $226B | 3.1% |
| 10 | 🇮🇳 India | $224B | 3.1% |
| 11 | 🇭🇰 Hong Kong | $221B | 3.0% |
| 12 | 🇧🇷 Brazil | $217B | 3.0% |
| 13 | 🇨🇦 Canada | $215B | 2.9% |
| 14 | 🇫🇷 France | $189B | 2.6% |
| 15 | 🇸🇬 Singapore | $179B | 2.4% |
| 16 | 🇸🇦 Saudi Arabia | $120B | 1.6% |
| 17 | 🇰🇷 South Korea | $103B | 1.4% |
| 18 | 🇩🇪 Germany | $101B | 1.4% |
| 19 | 🇳🇴 Norway | $92B | 1.3% |
| 20 | 🇧🇲 Bermuda | $82B | 1.1% |
| 21 | 🇳🇱 Netherlands | $67B | 0.9% |
| 22 | 🇲🇽 Mexico | $59B | 0.8% |
| 23 | 🇦🇪 UAE | $59B | 0.8% |
| 24 | 🇦🇺 Australia | $57B | 0.8% |
| 25 | 🇰🇼 Kuwait | $49B | 0.7% |
| 26 | 🇵🇭 Philippines | $48B | 0.7% |
| 27 | 🇮🇱 Israel | $48B | 0.7% |
| 28 | 🇧🇸 Bahamas | $46B | 0.6% |
| 29 | 🇹🇭 Thailand | $46B | 0.6% |
| 30 | 🇸🇪 Sweden | $42B | 0.6% |
| 31 | 🇮🇶 Iraq | $41B | 0.6% |
| 32 | 🇨🇴 Colombia | $40B | 0.5% |
| 33 | 🇮🇹 Italy | $39B | 0.5% |
| 34 | 🇵🇱 Poland | $38B | 0.5% |
| 35 | 🇪🇸 Spain | $37B | 0.5% |
| 36 | 🇻🇳 Vietnam | $37B | 0.5% |
| 37 | 🇨🇱 Chile | $34B | 0.5% |
| 38 | 🇵🇪 Peru | $32B | 0.4% |
| All Other | $439B | 6.0% |
As the above table shows, the United Kingdom is the third highest holder, at over $655 billion in Treasuries. Across Europe, 13 countries are notable holders of these securities, the highest in any region, followed by Asia-Pacific at 11 different holders.
A handful of small nations own a surprising amount of U.S. debt. With a population of 70,000, the Cayman Islands own a towering amount of Treasury bonds to the tune of $284 billion. There are more hedge funds domiciled in the Cayman Islands per capita than any other nation worldwide.
In fact, the four smallest nations in the visualization above—Cayman Islands, Bermuda, Bahamas, and Luxembourg—have a combined population of just 1.2 million people, but own a staggering $741 billion in Treasuries.
Interest Rates and Treasury Market Dynamics
Over 2022, foreign demand for Treasuries sank 6% as higher interest rates and a strong U.S. dollar made owning these bonds less profitable.
This is because rising interest rates on U.S. debt makes the present value of their future income payments lower. Meanwhile, their prices also fall.
As the chart below shows, this drop in demand is a sharp reversal from 2018-2020, when demand jumped as interest rates hovered at historic lows. A similar trend took place in the decade after the 2008-09 financial crisis when U.S. debt holdings effectively tripled from $2 to $6 trillion.

Driving this trend was China’s rapid purchase of Treasuries, which ballooned from $100 billion in 2002 to a peak of $1.3 trillion in 2013. As the country’s exports and output expanded, it sold yuan and bought dollars to help alleviate exchange rate pressure on its currency.
Fast-forward to today, and global interest-rate uncertainty—which in turn can impact national currency valuations and therefore demand for Treasuries—continues to be a factor impacting the future direction of foreign U.S. debt holdings.


Markets
A Visual Guide to Bond Market Dynamics
What factors impact the bond market? Here’s how current interest rates, bond returns, and market volatility compare in a historical context.


A Visual Guide to Bond Market Dynamics
Bond markets have been rattled given recent events in the banking industry.
The good news is that the Federal Reserve, U.S. Treasury, and Federal Deposit Insurance Corporation are taking action to restore confidence and take the appropriate measures to help provide stability in the market.
With this in mind, the above infographic from New York Life Investments looks at the factors that impact bonds, how different types of bonds have historically performed across market environments, and the current bond market volatility in a broader context.
Bond Market Returns
Bonds had a historic year in 2022, posting one of the worst returns ever recorded.
As interest rates rose at the fastest pace in 40 years, it pushed bond prices lower due to their inverse relationship. In a rare year, bonds dropped 13%.
| Year | Bloomberg U.S. Aggregate Bond Index Total Return |
|---|---|
| 2022 | -13.0% |
| 2021 | -1.5% |
| 2020 | 8.7% |
| 2019 | 7.5% |
| 2018 | 0.0% |
| 2017 | 3.5% |
| 2016 | 2.7% |
| 2015 | 0.6% |
| 2014 | 6.0% |
| 2013 | -2.0% |
| 2012 | 4.2% |
| 2011 | 7.8% |
| 2010 | 6.5% |
| 2009 | 5.9% |
| 2008 | 5.2% |
| 2007 | 7.0% |
| 2006 | 4.3% |
| 2005 | 2.4% |
| 2004 | 4.3% |
| 2003 | 4.1% |
| 2002 | 10.3% |
| 2001 | 8.4% |
| 2001 | 8.4% |
| 2000 | 11.6% |
| 1999 | -0.8% |
| 1998 | 8.7% |
| 1997 | 9.7% |
| 1996 | 3.6% |
| 1995 | 18.5% |
| 1994 | -2.9% |
| 1993 | 9.8% |
| 1992 | 7.4% |
| 1991 | 16.0% |
| 1990 | 9.0% |
| 1989 | 14.5% |
| 1988 | 7.9% |
| 1987 | 2.8% |
| 1986 | 15.3% |
| 1985 | 22.1% |
| 1984 | 15.2% |
| 1983 | 8.4% |
| 1982 | 32.6% |
| 1981 | 6.3% |
| 1980 | 2.7% |
| 1979 | 1.9% |
| 1978 | 1.4% |
| 1977 | 3.0% |
| 1976 | 15.6% |
| 1993 | 9.8% |
| 1992 | 7.4% |
| 1991 | 16.0% |
| 1990 | 9.0% |
| 1989 | 14.5% |
| 1988 | 7.9% |
| 1987 | 2.8% |
| 1986 | 15.3% |
| 1985 | 22.1% |
| 1984 | 15.2% |
| 1983 | 8.4% |
| 1982 | 32.6% |
| 1981 | 6.3% |
| 1980 | 2.7% |
| 1979 | 1.9% |
| 1978 | 1.4% |
| 1977 | 3.0% |
| 1976 | 15.6% |
Source: FactSet, 01/02/2023.
Bond prices are only one part of a bond’s total return—the other looks at the income a bond provides. As interest rates have increased in the last year, it has driven higher bond yields in 2023.
| Type | Yield (Mar 21, 2022) | Yield (Mar 20, 2023) |
|---|---|---|
| Treasuries (2-Year) | 2.1% | 3.9% |
| Treasuries (5-Year) | 2.3% | 3.6% |
| TIPS (10-Year Breakeven) | 2.9% | 2.1% |
| Corporate Bonds | 3.5% | 4.5% |
Source: YCharts, 3/20/2023.
With this recent performance in mind, let’s look at some other key factors that impact the bond market.
Factors Impacting Bond Markets
Interest rates play a central role in bond market dynamics. This is because they affect a bond’s price. When rates are rising, existing bonds with lower rates are less valuable and prices decline. When rates are dropping, existing bonds with higher rates are more valuable and their prices rise.
In March, the Federal Reserve raised rates 25 basis points to fall within the 4.75%-5.00% range, a level not seen since September 2007. Here are projections for where the federal funds rate is headed in 2023:
- Federal Reserve Projection*: 5.1%
- Economist Projections**: 5.3%
*Based on median estimates in the March summary of quarterly economic projections.**Projections based on March 10-15 Bloomberg economist survey.
Together, interest rates and the macroenvironment can have a positive or negative effect on bonds.
Positive
Here are three variables that may affect bond prices in a positive direction:
- Lower Inflation: Reduces likelihood of interest rate hikes.
- Lower Interest Rates: When rates are falling, bond prices are typically higher.
- Recession: Can prompt a cut in interest rates, boosting bond prices.
Negative
On the other hand, here are variables that may negatively impact bond prices:
- Higher Inflation: Can increase the likelihood of the Federal Reserve to raise interest rates.
- Rising Interest Rates: Interest rate hikes lead bond prices to fall.
- Weaker Fundamentals: When a bond’s credit risk gets worse, its price can drop. Credit risk indicates the chance of a default, the risk of a bond issuer not making interest payments within a given time period.
Bonds have been impacted by these negative factors since inflation started rising in March 2021.
Fixed Income Opportunities
Below, we show the types of bonds that have had the best performance during rising rates and recessions.
| Type | Rising Interest Rates (%) | Recession (%) | Overall Average Return (%) |
|---|---|---|---|
| U.S. Ultrashort | 4.2 | 6.3 | 4.2 |
| Municipal Bond | 3.4 | 5.2 | 5.6 |
| Fixed Income (Diversified) | 3.1 | 9.0 | 6.3 |
| World Bond | 3.1 | 9.7 | 6.4 |
| U.S. Short-Term | 2.8 | 8.6 | 5.1 |
| U.S. Long-Term | 2.5 | 11.2 | 7.7 |
| Mortgage Bond | 2.2 | 11.4 | 5.7 |
Source: Derek Horstmeyer, George Mason University 12/3/2022.
As we can see, U.S. ultrashort bonds performed the best during rising rates. Mortgage bonds outperformed during recessions, averaging 11.4% returns, but with higher volatility. U.S. long-term bonds had 7.7% average returns, the best across all market conditions. In fact, they were also a close second during recessions.
When rates are rising, ultrashort bonds allow investors to capture higher rates when they mature, often with lower historical volatility.
A Closer Look at Bond Market Volatility
While bond market volatility has jumped this year, current dislocations may provide investment opportunities.
Bond dislocations allow investors to buy at lower prices, factoring in that the fundamental quality of the bond remains strong. With this in mind, here are two areas of the bond market that may provide opportunities for investors:
- Investment-Grade Corporate Bonds: Higher credit quality makes them potentially less vulnerable to increasing interest rates.
- Intermediate Bonds (2-10 Years): Allow investors to lock in higher rates.
Both types of bonds focus on quality and capturing higher yields when faced with challenging market conditions.
Finding the Upside
Much of the volatility seen in the banking sector was due to banks buying bonds during the pandemic—or even earlier—at a time when interest rates were historically low. Since then, rates have climbed considerably.
Should rates moderate or stop increasing, this may present better market conditions for bonds.
In this way, today’s steep discount in bond markets may present an attractive opportunity for price appreciation. At the same time, investors can potentially lock in strong yields as inflation may subside in the coming years ahead.
Learn more about bond investing strategies with New York Life Investments.

-
 Markets1 day ago
Which Countries Hold the Most U.S. Debt?
Foreign investors hold $7.3 trillion of the national U.S. debt. These holdings declined 6% in 2022 amid a strong U.S. dollar and rising rates.
-

 Investor Education3 days ago
Visualizing 90 Years of Stock and Bond Portfolio Performance
How have investment returns for different portfolio allocations of stocks and bonds compared over the last 90 years?
-

 Economy3 days ago
Visualizing the Link Between Unemployment and Recessions
This infographic examines 50 years of data to highlight a clear visual trend: recessions are preceded by a cyclical low in unemployment.
-

 Culture5 days ago
Mapped: The World’s Happiest Countries in 2023
Where do the happiest people on earth live? This map is a snapshot of the world’s most (and least) happy countries in 2023.
-

 Money1 week ago
The Richest People in the World in 2023
The world’s five richest people are worth a combined $729 billion. From luxury moguls to Asia’s rising titans, we show the richest in 2023.
-

 Gold1 week ago
Charted: 30 Years of Central Bank Gold Demand
Globally, central banks bought a record 1,136 tonnes of gold in 2022. How has central bank gold demand changed over the last three decades?


-
 Datastream2 weeks ago
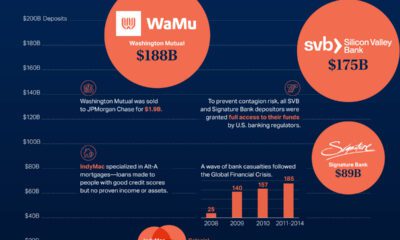
The Largest U.S. Bank Failures in Modern History
-

 Jobs3 weeks ago
Visualized: The State of the U.S. Labor Market
-

 Money2 weeks ago
The Growing Auto Loan Problem Facing Young Americans
-

 Africa3 weeks ago
Ranked: Who Are the Richest People in Africa?
-

 Datastream1 week ago
Will Connected Cars Break the Internet?
-

 Energy3 weeks ago
Mapped: Asia’s Biggest Sources of Electricity by Country
-

 Inequality1 week ago
Mapped: Minimum Wage Around the World
-

 Finance3 weeks ago
Ranked: The World’s Most Valuable Bank Brands (2019-2023)