Energy
How Does U.S. Electricity Generation Change Over One Week?
Subscribe to the Decarbonization Channel’s free mailing list for more like this
How Does U.S. Electricity Generation Change in a Week?
This was originally posted on the Decarbonization Channel. Subscribe to the free mailing list to be the first to see graphics related to decarbonization with a focus on the U.S. energy sector.
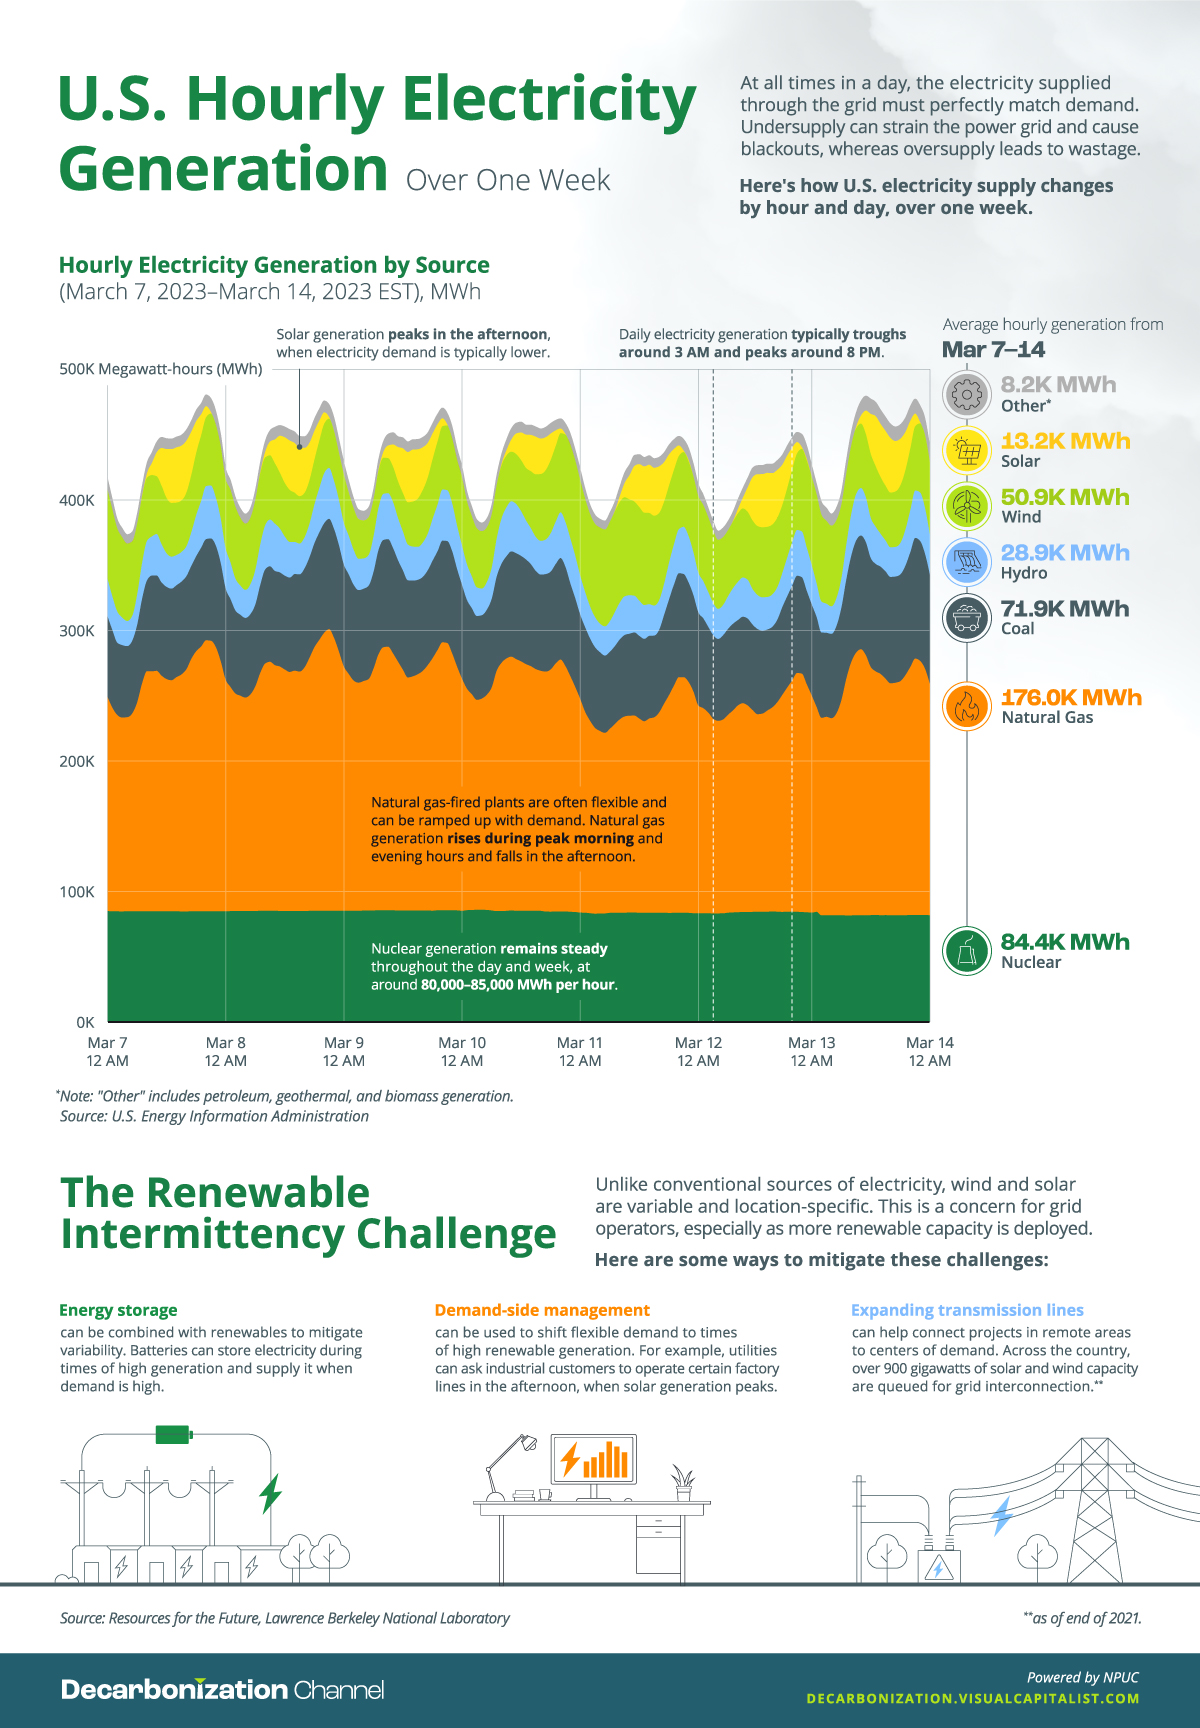
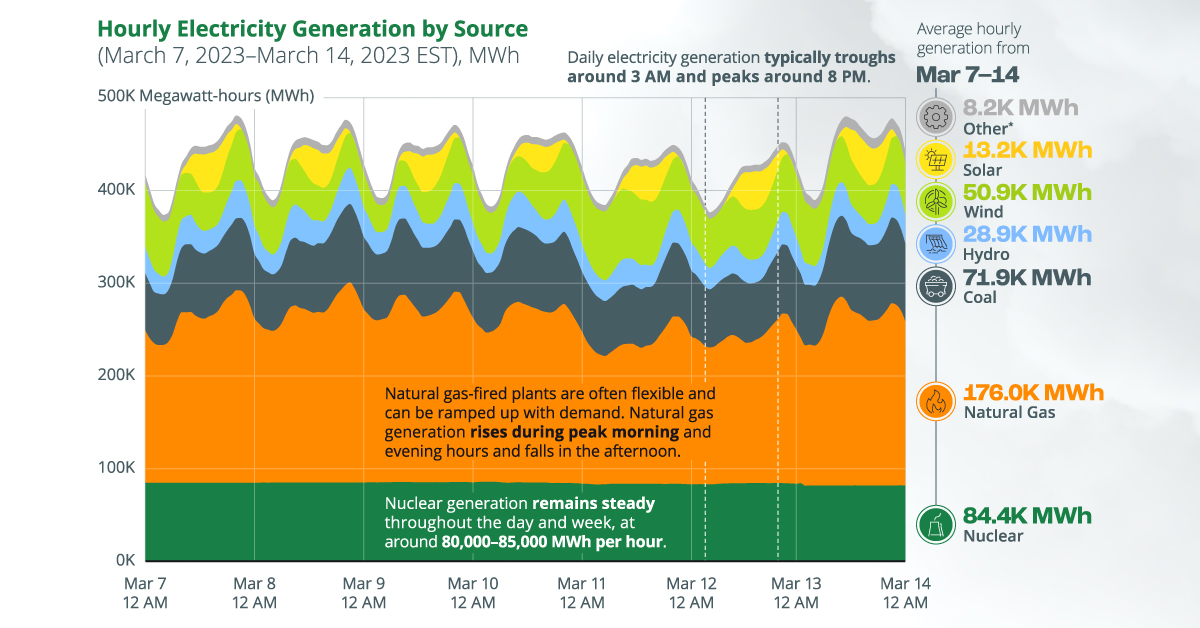
The U.S. has a dynamic electricity mix, with a range of energy sources generating electricity at different times of the day.
At all times, the amount of electricity generated must match demand in order to keep the power grid in balance, which leads to cyclical patterns in daily and weekly electricity generation.
The above graphic tracks hourly changes in U.S. electricity generation over one week, based on data from the U.S. Energy Information Administration (EIA).
The Three Types of Power Plants
Before diving in, it’s important to distinguish between the three main types of power plants in the U.S. electricity mix:
- Base load plants generally run at full or near-full capacity and are used to meet the base load or the minimum amount of electricity demanded at all times. These are typically coal-fired or nuclear power plants. If regionally available, geothermal and hydropower plants can also be used as baseload sources.
- Peak load or peaking power plants are typically dispatchable and can be ramped up quickly during periods of high demand. These plants usually operate at maximum capacity only for a few hours a day and include gas-fired and pumped-storage hydropower plants.
- Intermediate load plants are used during the transitory hours between base load and peak load demand. Intermittent renewable sources like wind and solar (without battery storage) are suitable for intermediate use, along with other sources.
Zooming In: The U.S. Hourly Electricity Mix
With that context, the table below provides an overview of average hourly electricity generation by source for the week of March 7–March 14, 2023, in the Eastern Time Zone.
It’s worth noting that while this is representative of a typical week of electricity generation, these patterns can change with seasons. For example, in the month of June, electricity demand usually peaks around 5 PM, when solar generation is still high, unlike in March.
| Energy Source | Type | Avg. Hourly Electricity Generation, MWh (Mar 07–14, 2023, EST) |
|---|---|---|
| Natural Gas | Fossil fuel | 175,967 |
| Nuclear | Non-renewable | 84,391 |
| Coal | Fossil fuel | 71,922 |
| Wind | Renewable | 50,942 |
| Hydro | Renewable | 28,889 |
| Solar | Renewable | 13,213 |
| Other | Mixed | 8,192 |
Natural gas is the country’s largest source of electricity, with gas-fired plants generating an average of 176,000 MWh of electricity per hour throughout the week outlined above. The dispatchable nature of natural gas is evident in the chart, with gas-fired generation falling in the wee hours and rising during business hours.
Meanwhile, nuclear electricity generation remains steady throughout the given days and week, ranging between 80,000–85,000 MWh per hour. Nuclear plants are designed to operate for long durations (1.5 to 2 years) before refueling and require less maintenance, allowing them to provide reliable baseload energy.
On the other hand, wind and solar generation tend to see large fluctuations throughout the week. For example, during the week of March 07–14, wind generation ranged between 26,875 MWh and 77,185 MWh per hour, based on wind speeds. Solar generation had stronger extremes, often reaching zero or net-negative at night and rising to over 40,000 MWh in the afternoon.
Because wind and solar are often variable and location-specific, integrating them into the grid can pose challenges for grid operators, who rely on forecasts to keep electricity supply and demand in balance. So, what are some ways to solve these problems?
Solving the Renewable Intermittency Challenge
As more renewable capacity is deployed, here are three ways to make the transition smoother.
- Energy storage systems can be combined with renewables to mitigate variability. Batteries can store electricity during times of high generation (for example, in the afternoon for solar), and supply it during periods of peak demand.
- Demand-side management can be used to shift flexible demand to times of high renewable generation. For instance, utilities can collaborate with their industrial customers to ensure that certain factory lines only run in the afternoon, when solar generation peaks.
- Expanding transmission lines can help connect high-quality solar and wind resources in remote regions to centers of demand. In fact, as of the end of 2021, over 900 gigawatts of solar and wind capacity (notably more than the country’s current renewable capacity) were queued for grid interconnection.


Energy
Where are Clean Energy Technologies Manufactured?
As the market for low-emission solutions expands, China dominates the production of clean energy technologies and their components.
Visualizing Where Clean Energy Technologies Are Manufactured
This was originally posted on Elements. Sign up to the free mailing list to get beautiful visualizations on natural resource megatrends in your email every week.
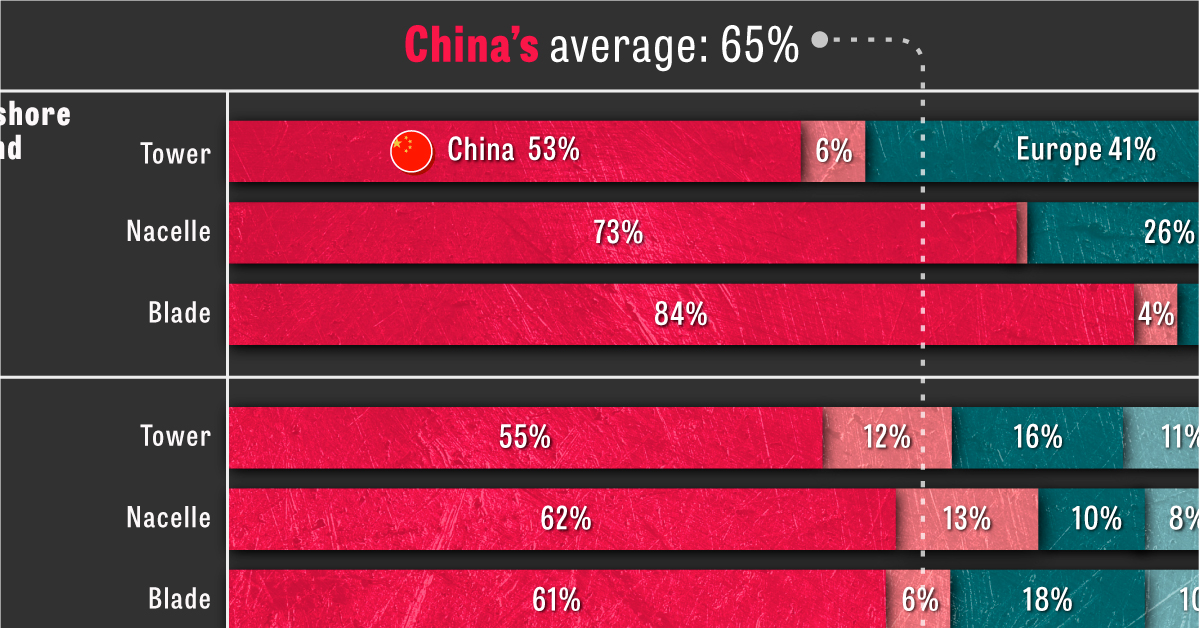
When looking at where clean energy technologies and their components are made, one thing is very clear: China dominates the industry.
The country, along with the rest of the Asia Pacific region, accounts for approximately 75% of global manufacturing capacity across seven clean energy technologies.
Based on the IEA’s 2023 Energy Technology Perspectives report, the visualization above breaks down global manufacturing capacity by region for mass-manufactured clean energy technologies, including onshore and offshore wind, solar photovoltaic (PV) systems, electric vehicles (EVs), fuel cell trucks, heat pumps, and electrolyzers.
The State of Global Manufacturing Capacity
Manufacturing capacity refers to the maximum amount of goods or products a facility can produce within a specific period. It is determined by several factors, including:
- The size of the manufacturing facility
- The number of machines or production lines available
- The skill level of the workforce
- The availability of raw materials
According to the IEA, the global manufacturing capacity for clean energy technologies may periodically exceed short-term production needs. Currently, this is true especially for EV batteries, fuel cell trucks, and electrolyzers. For example, while only 900 fuel cell trucks were sold globally in 2021, the aggregate self-reported capacity by manufacturers was 14,000 trucks.
With that said, there still needs to be a significant increase in manufacturing capacity in the coming decades if demand aligns with the IEA’s 2050 net-zero emissions scenario. Such developments require investments in new equipment and technology, developing the clean energy workforce, access to raw and refined materials, and optimizing production processes to improve efficiency.
What Gives China the Advantage?
Of the above clean energy technologies and their components, China averages 65% of global manufacturing capacity. For certain components, like solar PV wafers, this percentage is as high as 96%.
Here’s a breakdown of China’s manufacturing capacity per clean energy technology.
| Technology | China’s share of global manufacturing capacity, 2021 |
|---|---|
| Wind (Offshore) | 70% |
| Wind (Onshore) | 59% |
| Solar PV Systems | 85% |
| Electric Vehicles | 71% |
| Fuel Cell Trucks | 47% |
| Heat Pumps | 39% |
| Electrolyzers | 41% |
So, what gives China this advantage in the clean energy technology sector? According to the IEA report, the answer lies in a combination of factors:
- Low manufacturing costs
- A dominance in clean energy metal processing, namely cobalt, lithium, and rare earth metals
- Sustained policy support and investment
The mixture of these factors has allowed China to capture a significant share of the global market for clean technologies while driving down the cost of clean energy worldwide.
As the market for low-emission solutions expands, China’s dominance in the sector will likely continue in the coming years and have notable implications for the global energy and emission landscape.

-
 Politics1 week ago
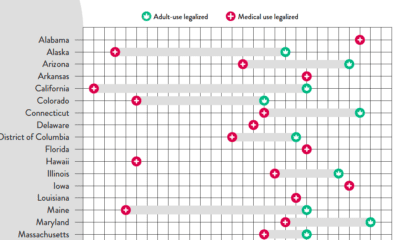
Timeline: Cannabis Legislation in the U.S.
-

 Datastream3 weeks ago
The Largest U.S. Bank Failures in Modern History
-

 Energy1 week ago
Where are Clean Energy Technologies Manufactured?
-

 Money3 weeks ago
The Growing Auto Loan Problem Facing Young Americans
-

 Datastream1 week ago
Ranked: The 25 Poorest Countries by GDP per Capita
-
 Datastream3 weeks ago
Network Overload? Adding Up the Data Produced By Connected Cars
-

 Datastream1 week ago
Ranked: The World’s 25 Richest Countries by GDP per Capita
-

 Maps3 weeks ago
Mapped: Minimum Wage Around the World