Markets
Visualizing the S&P 500’s Performance in 2023 So Far

Article/Editing:
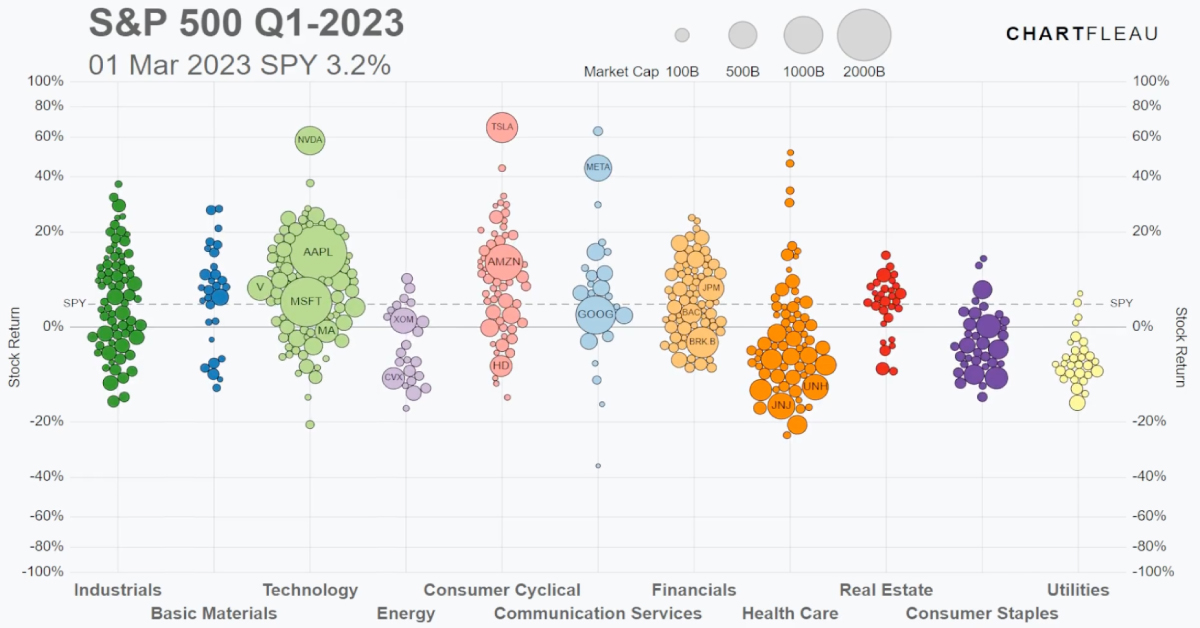
The S&P 500’s Performance in 2023 Q1
With one quarter of 2023 in the books, how has the S&P 500 performed so far?
The index had a tumultuous 2022, ending the year down 18%, its worst performance since 2008. But so far, despite dealing with tight monetary conditions and an unexpected banking crisis, the S&P 500 has promptly started to rebound.
The above animation from Jan Varsava shows the stock performance of each company on the S&P 500, categorized by sector.
Biggest Gainers on the S&P 500
The S&P 500 increased 7.5% during the first quarter of 2023. Though it was led by a few big outperformers, more than half of the stocks on the index closed above their end-of-December prices.
Here are the top 30 biggest gainers on the index from January 1 to March 31, 2023.
| Rank | Company | 3-Month Return |
|---|---|---|
| 1 | Nvidia | 90.1% |
| 2 | Meta (Facebook) | 76.1% |
| 3 | Tesla | 68.4% |
| 4 | Warner Bros. Discovery | 59.3% |
| 5 | Align Technology | 58.4% |
| 6 | AMD | 51.3% |
| 7 | Salesforce | 50.7% |
| 8 | West Pharmaceuticals | 47.3% |
| 9 | General Electric | 46.3% |
| 10 | Catalent | 46.0% |
| 11 | First Solar | 45.2% |
| 12 | Monolithic Power Systems | 41.8% |
| 13 | MarketAxess Holdings | 40.6% |
| 14 | GE Healthcare Tech | 40.5% |
| 15 | Arista Networks | 38.3% |
| 16 | ANSYS Inc. | 37.8% |
| 17 | Fortinet Inc. | 35.9% |
| 18 | Wynn Resorts | 35.7% |
| 19 | Paramount Global | 33.8% |
| 20 | FedEx Corp | 32.7% |
| 21 | MGM Resorts | 32.5% |
| 22 | Royal Caribbean Group | 32.1% |
| 23 | ON Semiconductor Corp | 32.0% |
| 24 | Booking Holdings | 31.6% |
| 25 | Cadence Design Systems | 30.8% |
| 26 | Skyworks Solutions | 30.2% |
| 27 | Pulte Group | 28.4% |
| 28 | Seagate Technology | 27.1% |
| 29 | Apple | 27.1% |
| 30 | Lam Research | 26.6% |
Nvidia shares gained the most of all the companies on the S&P 500 in Q1 2023, posting a staggering 90% return over three months.
As the world’s largest chipmaker by market cap, Nvidia gained from both strong earnings and semiconductor industry performance. It also benefited from the rising prevalence of artificial intelligence (AI) through software like ChatGPT.
Meanwhile, other tech giants Apple and Microsoft gained 27% and 21% respectively over the same time period.
Tech Leads Returns by Sector
The technology sector as a whole was the best performing sectoral index thanks to these big moves, up 21.7% at the end of March.
| Sector | 3-Month Return |
|---|---|
| Technology | 21.65% |
| Consumer Services | 21.27% |
| Consumer Discretionary | 16.60% |
| Materials | 4.29% |
| Industrials | 3.47% |
| Real Estate | 1.95% |
| Consumer Staples | 0.72% |
| Utilities | -3.24% |
| Health Care | -4.31% |
| Energy | -4.37% |
| Financials | -5.56% |
| S&P 500 | 7.5% |
Shares of other tech-adjacent companies like Meta (formerly Facebook) and Tesla—listed on the S&P 500 under the categories of communication services and consumer discretionary—also had a strong start to the year and lifted their respective sectors.
Meta in particular is up 76% in Q1 2023, continuing its rebound after falling to an eight-year low in November 2022 on the back of better-than-expected fourth quarter results and share buybacks.
Biggest Losers on the S&P 500
On the other side of the S&P 500, the financial sector was rocked by sudden collapses.
Signature Bank and Silicon Valley Financial Group shares lost the most ground in the first quarter, after both banks collapsed, shedding nearly all of their value in a matter of 30 days.
In fact, seven of the 10 worst performers on the index to start 2023 are banks or financial companies. The visualization shows the ripple effect on the market after the collapse of regional banks in March, and the ensuing rout driving the entire sector down 5.6% year-to-date.
Here are the top 30 biggest losers on the index from January 1 to March 31, 2023.
| Rank | Company | 3-Month Return |
|---|---|---|
| 1 | Signature Bank | -99.8% |
| 2 | Silicon Valley Financial Group | -99.6% |
| 3 | First Republic Bank | -88.5% |
| 4 | Lumen Technologies | -49.2% |
| 5 | Zions Bancorporation | -38.6% |
| 6 | Charles Schwab Corp | -36.9% |
| 7 | Comerica Incorporated | -33.9% |
| 8 | DISH Network | -33.5% |
| 9 | KeyCorp | -27.3% |
| 10 | Lincoln National Corp | -25.8% |
| 11 | Centene Corporation | -22.9% |
| 12 | Cigna Group | -22.5% |
| 13 | APA Corporation | -22.3% |
| 14 | Citizens Financial Group | -22.1% |
| 15 | Enphase Energy Inc. | -20.6% |
| 16 | Baxter International Inc. | -19.9% |
| 17 | Truist Financial Corporation | -19.9% |
| 18 | American International Group | -19.8% |
| 19 | CVS Health Corporation | -19.7% |
| 20 | Pfizer | -19.6% |
| 21 | Gen Digital | -19.5% |
| 22 | MetLife | -19.4% |
| 23 | Huntington Bancshares | -19.4% |
| 24 | Fidelity National | -19.3% |
| 25 | Halliburton Company | -19.2% |
| 26 | Molina Healthcare | -19.0% |
| 27 | PNC Financial Services | -18.8% |
| 28 | Boston Properties | -18.4% |
| 29 | Fifth Third Bancorp | -17.8% |
| 30 | Allstate Corporation | -17.7% |
Despite the tight monetary landscape, traditionally defensive sectors like energy, consumer staples, and healthcare also underperformed the broader index. This is a reversal from market trends seen in 2022.
Investment Trends to Watch for in 2023
Experts predict a pause in U.S. interest rate hikes “sometime in 2023” but it’s unclear when (or at what level) the pause will take place given persistent inflation in the economy.
However, if interest rates level off in 2023, it could be a key momentum maker for the S&P 500. As Barron’s points out, the index tends to rise after hikes are paused.
Meanwhile, the current tumult in the financial sector is fanning the flames of recessionary fears. How effectively regulators manage the crisis might be the story of the year.
Finally, as we have seen in 2023 so far, investor interest in AI has sent tech stocks soaring. Is this a quick fad, or an overarching trend for the year?

This article was published as a part of Visual Capitalist's Creator Program, which features data-driven visuals from some of our favorite Creators around the world.


Markets
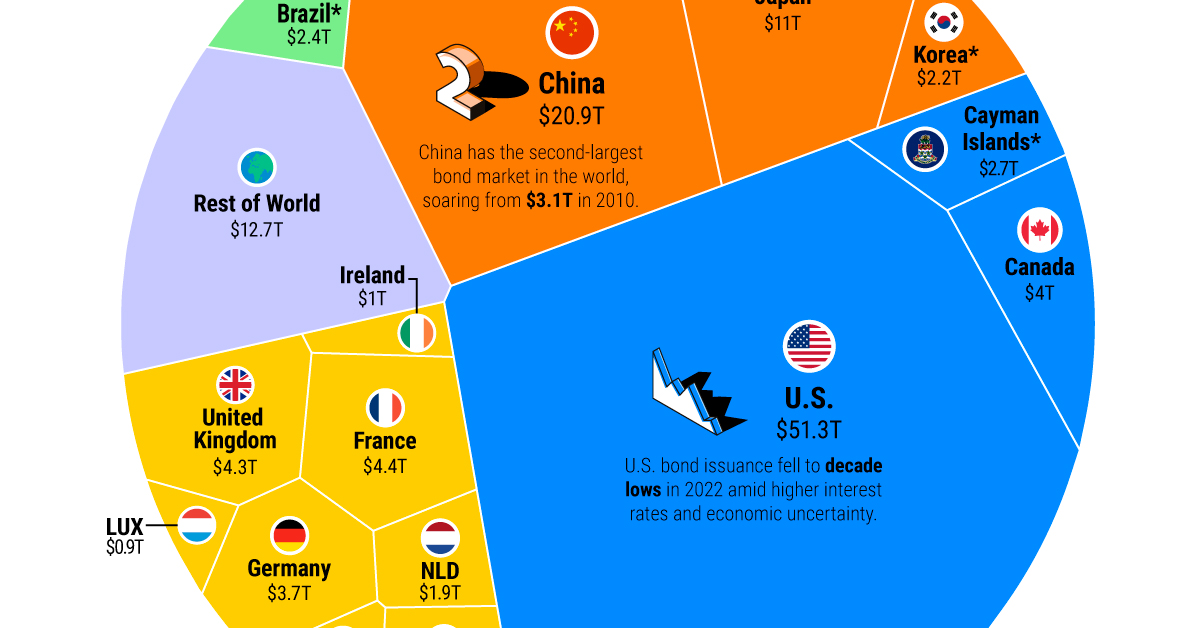
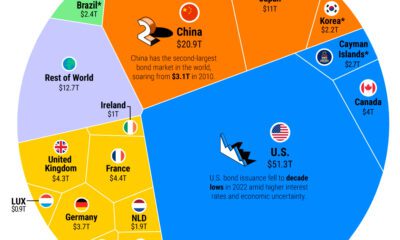
Ranked: The Largest Bond Markets in the World
The global bond market stands at $133 trillion in value. Here are the major players in bond markets worldwide.
The Largest Bond Markets in the World
This was originally posted on Advisor Channel. Sign up to the free mailing list to get beautiful visualizations on financial markets that help advisors and their clients.
In 2022, the global bond market totaled $133 trillion.
As one of the world’s largest capital markets, debt securities have grown sevenfold over the last 40 years. Fueling this growth are government and corporate debt sales across major economies and emerging markets. Over the last three years, China’s bond market has grown 13% annually.
Based on estimates from the Bank for International Statements, this graphic shows the largest bond markets in the world.
Ranked: The World’s Top Bond Markets
Valued at over $51 trillion, the U.S. has the largest bond market globally.
Government bonds made up the majority of its debt market, with over $26 trillion in securities outstanding. In 2022, the Federal government paid $534 billion in interest on this debt.
China is second, at 16% of the global total. Local commercial banks hold the greatest share of its outstanding bonds, while foreign ownership remains fairly low. Foreign interest in China’s bonds slowed in 2022 amid geopolitical tensions in Ukraine and lower yields.
| Bond Market Rank | Country / Region | Total Debt Outstanding | Share of Total Bond Market |
|---|---|---|---|
| 1 | 🇺🇸 U.S. | $51.3T | 39% |
| 2 | 🇨🇳 China | $20.9T | 16% |
| 3 | 🇯🇵 Japan | $11.0T | 8% |
| 4 | 🇫🇷 France | $4.4T | 3% |
| 5 | 🇬🇧 United Kingdom | $4.3T | 3% |
| 6 | 🇨🇦 Canada | $4.0T | 3% |
| 7 | 🇩🇪 Germany | $3.7T | 3% |
| 8 | 🇮🇹 Italy | $2.9T | 2% |
| 9 | 🇰🇾 Cayman Islands* | $2.7T | 2% |
| 10 | 🇧🇷 Brazil* | $2.4T | 2% |
| 11 | 🇰🇷 South Korea* | $2.2T | 2% |
| 12 | 🇦🇺 Australia | $2.2T | 2% |
| 13 | 🇳🇱 Netherlands | $1.9T | 1% |
| 14 | 🇪🇸 Spain | $1.9T | 1% |
| 15 | 🇮🇳 India* | $1.3T | 1% |
| 16 | 🇮🇪 Ireland | $1.0T | 1% |
| 17 | 🇲🇽 Mexico* | $1.0T | 1% |
| 18 | 🇱🇺 Luxembourg | $0.9T | 1% |
| 19 | 🇧🇪 Belgium | $0.7T | >1% |
| 20 | 🇷🇺 Russia* | $0.7T | >1% |
*Represent countries where total debt securities were not reported by national authorities. These figures are the sum of domestic debt securities reported by national authorities and/or international debt securities compiled by BIS.
Data as of Q3 2022.
As the above table shows, Japan has the third biggest debt market. Japan’s central bank owns a massive share of its government bonds. Central bank ownership hit a record 50% as it tweaked its yield curve control policy that was introduced in 2016. The policy was designed to help boost inflation and prevent interest rates from falling. As inflation began to rise in 2022 and bond investors began selling, it had to increase its yield to spur demand and liquidity. The adjustment sent shockwaves through financial markets.
In Europe, France is home to the largest bond market at $4.4 trillion in total debt, surpassing the United Kingdom by roughly $150 billion.
Banks: A Major Buyer in Bond Markets
Like central banks around the world, commercial banks are key players in bond markets.
In fact, commercial banks are among the top three buyers of U.S. government debt. This is because commercial banks will reinvest client deposits into interest-bearing securities. These often include U.S. Treasuries, which are highly liquid and one of the safest assets globally.
As we can see in the chart below, the banking sector often surpasses an economy’s total GDP.
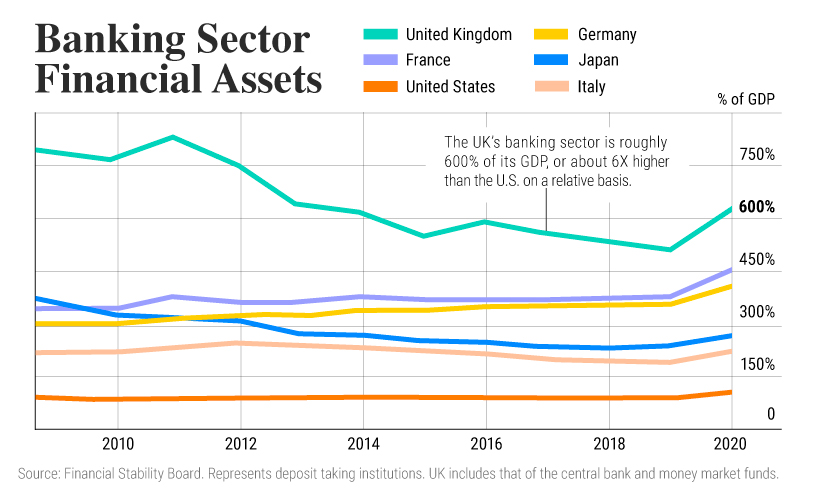
As interest rates have risen sharply since 2022, the price of bonds has been pushed down, given their inverse relationship. This has raised questions about what type of bonds banks hold.
In the U.S., commercial banks hold $4.2 trillion in Treasury bonds and other government securities. For large U.S. banks, these holdings account for almost 24% of assets on average. They make up an average 15% of assets for small banks in 2023. Since mid-2022, small banks have reduced their bond holdings due to interest rate increases.
As higher rates reverberate across the banking system and wider economy, it may expose further strains on global bond markets which have expanded rapidly in an era of dovish monetary policy and ultra-low interest rates.
-
 Markets5 days ago
Ranked: The Largest Bond Markets in the World
-

 Datastream3 weeks ago
Ranked: The 25 Poorest Countries by GDP per Capita
-

 VC+5 days ago
Bonus Gift: Celebrating the Best of the VC+ Archive
-

 Datastream3 weeks ago
Ranked: The World’s 25 Richest Countries by GDP per Capita
-

 Green4 days ago
Mapped: Air Pollution Levels Around the World in 2022
-

 Environment3 weeks ago
Visualizing the Flow of Energy-Related CO2 Emissions in the U.S.
-
 Datastream2 days ago
More U.S. Tech Companies are Adopting Unequal Dual-Class Voting Structures
-
 China3 weeks ago
De-Dollarization: Countries Seeking Alternatives to the U.S. Dollar