Technology
Ranked: Who Made the Most U.S. Unicorn Acquisitions Since 1997?

Article/Editing:
Who Made the Most U.S. Unicorn Acquisitions Since 1997?
The elusive unicorn is no longer a myth in the U.S. startup world, with over a thousand private startups reaching a $1 billion valuation in the last 25 years.
While some of these startups eventually go public and go on to become household names, it’s also common for founders to exit through mergers and acquisitions (M&A), by selling their startup to another organization. In fact, over half of the 1,110 unicorns in the U.S. have made some sort of an exit—either through an IPO, a direct listing, a SPAC or an acquisition—since 1997.
Ilya Strebulaev, professor of finance and private equity at the Stanford Graduate School of Business, brings us this visualization featuring the companies that acquired the most unicorns over the last 25 years.
Strebulaev’s database lists 137 private and public companies along with PE firms who’ve acquired at least one unicorn since 1997, totaling 177 acquisitions.
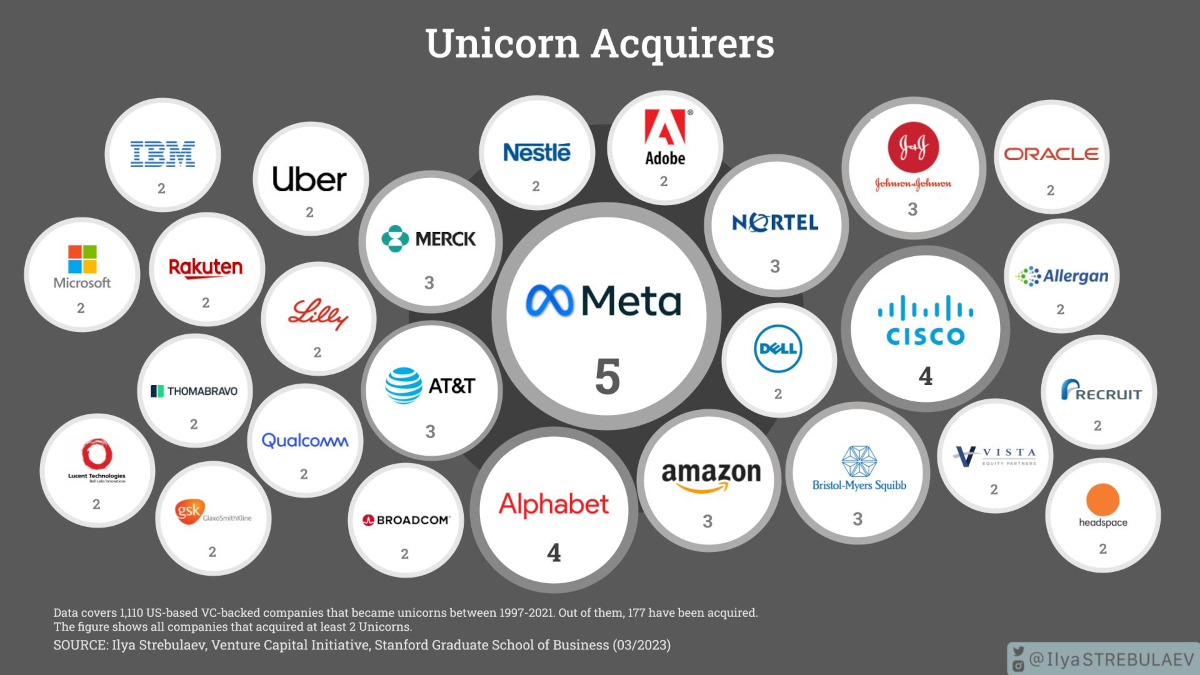
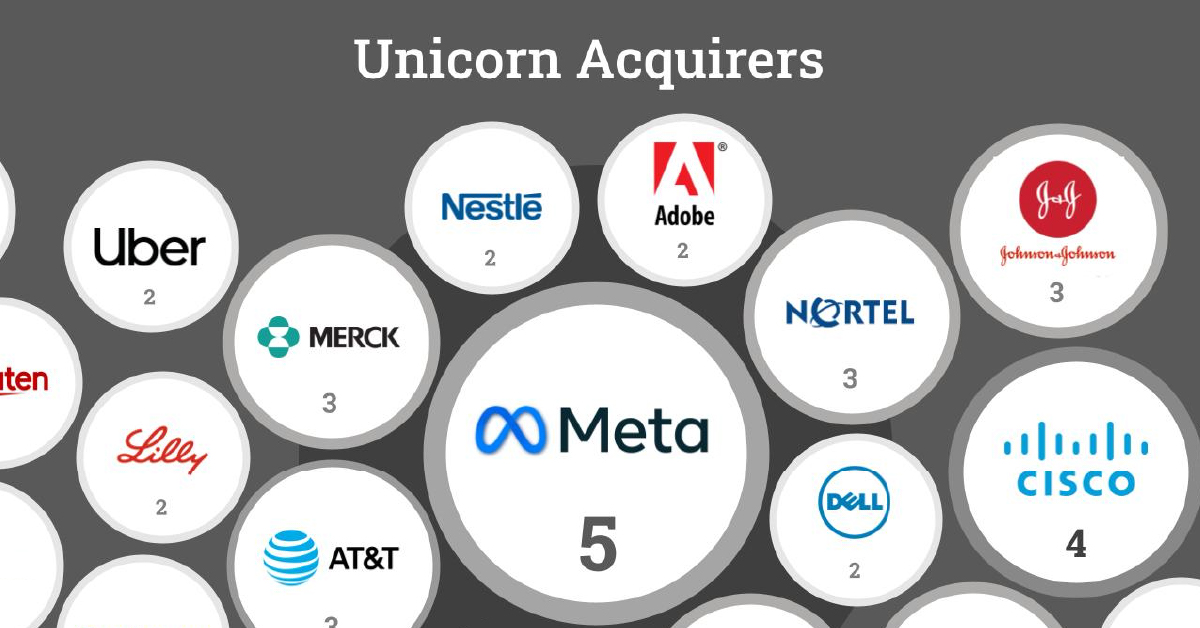
The Biggest U.S. Unicorn Acquirers
In total, 27 companies have acquired two or more unicorns, accounting for nearly 38% of all acquisitions. 110 companies have acquired just one unicorn.
| Company/ PE Group | Acquired |
|---|---|
| Meta | 5 |
| Cisco | 4 |
| Alphabet | 4 |
| Amazon | 3 |
| Nortel Networks | 3 |
| Bristol-Myers Squibb | 3 |
| Johnson & Johnson | 3 |
| Merck & Co. | 3 |
| AT&T | 3 |
| Recruit Holdings | 2 |
| IBM | 2 |
| Microsoft | 2 |
| Thoma Bravo | 2 |
| Headspace Health | 2 |
| Allergan | 2 |
| Qualcomm | 2 |
| Rakuten | 2 |
| Adobe Systems | 2 |
| Eli Lilly | 2 |
| Vista Equity | 2 |
| Dell | 2 |
| Uber | 2 |
| Oracle | 2 |
| Nestle | 2 |
| Lucent Technologies | 2 |
| Broadcom Corporation | 2 |
| GlaxoSmithKline | 2 |
| Searchlight Capital Partners | 1 |
| Singtel | 1 |
| Vmware | 1 |
| Internet Capital Group | 1 |
| Hellman & Friedman | 1 |
| AppLovin | 1 |
| Ciena Corporation | 1 |
| Redback Networks | 1 |
| Aether Systems | 1 |
| Fresenius Medical Care | 1 |
| Electronic Arts | 1 |
| Genentech | 1 |
| Inktomi | 1 |
| VistaJet | 1 |
| Ariba | 1 |
| Keurig Dr Pepper | 1 |
| Fullscreen | 1 |
| Sycamore Networks | 1 |
| Novartis | 1 |
| TP ICAP | 1 |
| eBay | 1 |
| DoveBid | 1 |
| McKesson | 1 |
| IG Group | 1 |
| Empower Retirement | 1 |
| Dentsply Sirona | 1 |
| Novo Nordisk | 1 |
| Centocor | 1 |
| Bausch Health | 1 |
| Dainippon Sumitomo Pharma | 1 |
| Medtronic | 1 |
| Mubadala Investment Company | 1 |
| Cint Group | 1 |
| Qualtrics | 1 |
| Rocket Companies | 1 |
| Saudi Arabia's PIF | 1 |
| Prosus | 1 |
| Cigna | 1 |
| One Medical | 1 |
| Exact Sciences | 1 |
| Teladoc Health | 1 |
| Ericsson | 1 |
| SoFi | 1 |
| PayPal Holdings | 1 |
| Bayer | 1 |
| Monsanto | 1 |
| AMD | 1 |
| Aurora | 1 |
| Marvell International | 1 |
| Bill.com | 1 |
| ADC | 1 |
| Blackberry | 1 |
| Dealertrack | 1 |
| Cox Enterprises | 1 |
| L'Oreal | 1 |
| AstraZeneca | 1 |
| Workday | 1 |
| Iron Mountain | 1 |
| Splunk | 1 |
| Stonepeak | 1 |
| American Express | 1 |
| OfferUp | 1 |
| VMware | 1 |
| Ontario Teachers' Pension Plan | 1 |
| Groupon | 1 |
| Allstate Corporation | 1 |
| 1 | |
| SAP | 1 |
| Mindbody | 1 |
| Mallinckrodt | 1 |
| BlackBerry | 1 |
| Walmart | 1 |
| GMT Communications | 1 |
| Brightstar Capital | 1 |
| Enterprise Holdings | 1 |
| Healtheon Corporation | 1 |
| Apple | 1 |
| PetSmart | 1 |
| Epiphany | 1 |
| Rice Energy | 1 |
| Unilever | 1 |
| SBA Communications | 1 |
| Bridgepoint Advisers | 1 |
| Aurea | 1 |
| Vector Capital | 1 |
| FireEye | 1 |
| Littlejohn & Co | 1 |
| Alexion | 1 |
| SoftBank Investment Advisers | 1 |
| Francisco Partners | 1 |
| Betfair Group | 1 |
| Shift Technologies | 1 |
| Hudson's Bay | 1 |
| Illumina | 1 |
| Hewlett Packard Enterprise | 1 |
| AbbVie | 1 |
| Salesforce | 1 |
| Hanergy | 1 |
| Teleflex | 1 |
| Twilio | 1 |
| Okta | 1 |
| Celgene | 1 |
| NantCell | 1 |
| VMware & EMC Corp | 1 |
| Intuit | 1 |
| Yahoo! | 1 |
| Netmarble Games | 1 |
| F5 Networks | 1 |
| Roche | 1 |
| Centerbridge Partners | 1 |
| Total | 177 |
Meta, the parent company of Facebook, leads the pack with the most unicorn acquisitions in the U.S., purchasing five unicorns since its founding in 2008, including: Kustomer, WhatsApp, Instagram, CTRL-Labs, and Oculus VR.
Notably, WhatsApp—which closed at a purchase price of $19 billion—was Meta’s most expensive acquisition yet, over nine times their next most expensive purchase, Oculus VR.
Meanwhile, Alphabet (now the parent company of Google) and Cisco are tied in second place with four U.S. unicorn acquisitions each.
- Alphabet: YouTube, Actifio, Nest Labs, Looker Data Sciences
- Cisco: Cerent, Duo Security, AppDynamics, Jasper
Unlike its Big Tech peers, Apple has only made the one U.S. unicorn acquisition: navigation company HopStop that helped bring public transit features to Apple Maps.
Meanwhile, 56% of acquirers received venture capital funding of their own when they were private companies. This includes pack leaders like Meta, Cisco, Alphabet, and Amazon.
Are Unicorn Acquisitions Slowing Down?
Unicorn acquisitions are driven by two factors: the rate at which new unicorns are minted, and the climate for M&A transactions more broadly.
To begin with, the minting of new unicorns is largely influenced by the venture funding environment. Funding opportunities increase when interest rates go down, which makes riskier, venture-scale ideas more enticing. During the last decade of persistently low interest rates up until 2022, unicorns flourished more than ever.
Meanwhile, as tech companies like Apple, Microsoft, Alphabet, and Meta began seeing outsized profits in the 2010s, venture investors and their LPs looked to get in on the ground floor of tech startups that could emulate their success, often paying premium valuations for the chance. Simultaneously, big tech looked to acquire unicorns themselves, both to augment their business lines and to squash potential competitors.
However, the era of “easy money” may have come to an end, and privately-held startups have seen valuations drop in recent years. This means that for the next little while—at least until monetary policy stops tightening—unicorns could become a rarer sight.
Unicorn acquisitions may also see a similar fate. Persistent inflation and the government anti-trust push are just some of the other factors that have led to VC-backed startup acquisitions falling to their lowest quarterly levels in a decade. The more expensive the valuation, the harder to find a buyer, which means that some unicorns may even lose their $1 billion tag even when they do get acquired.

This article was published as a part of Visual Capitalist's Creator Program, which features data-driven visuals from some of our favorite Creators around the world.


AI
Visualizing Global Attitudes Towards AI
We visualize survey results from over 19,000 adults across 28 countries to see how attitudes towards AI differ around the world.
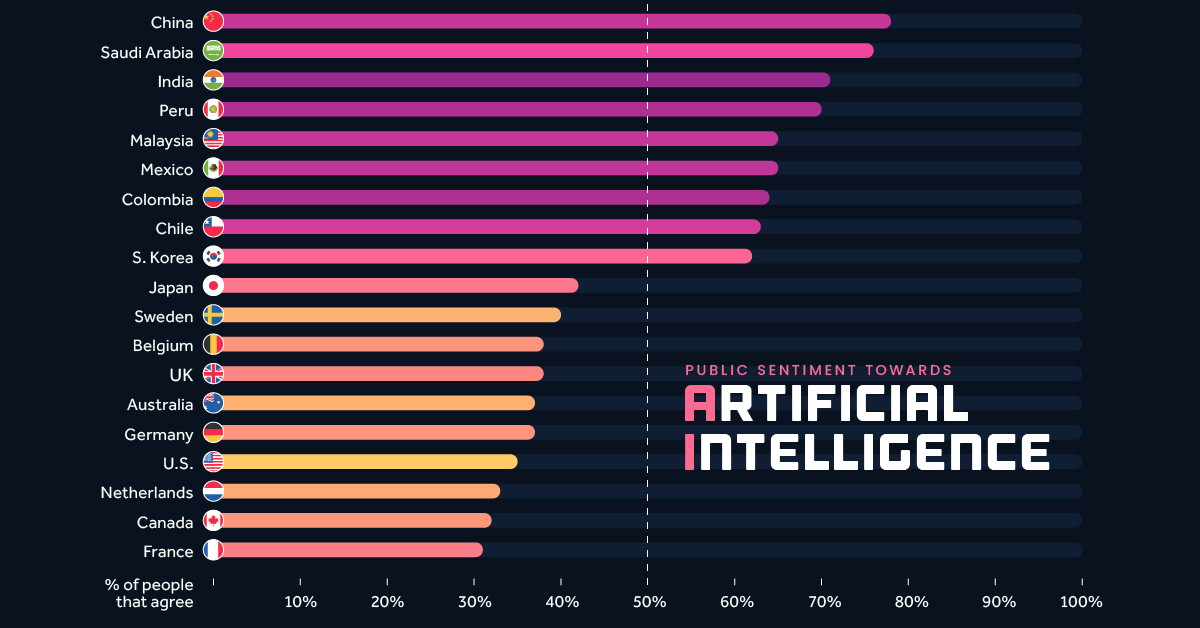
Comparing Public Sentiment Towards AI, by Country
Artificial intelligence (AI) is one of the fastest growing and most disruptive technologies in the world today. Because it has the potential to drastically impact society, it’s important to measure how people are feeling towards it.
This infographic visualizes survey data from market research firm, Ipsos, to see how attitudes towards AI varies by country. By including each country’s GDP per capita, we can see that wealthier populations are more skeptical about products and services that use the technology.
Data and Methodology
This data is based on a 28-country survey of 19,504 adults aged 18 to 74. Polling took place between November and December 2021, and the results were published in January 2022.
This survey took place before the recent explosion in popularity of generative AI tools such as ChatGPT, DALL-E, and Midjourney, but forms the foundation for how people view this rapidly improving technology.
The table below lists the percentage of respondents who agreed with the following statement:
“Products and services using artificial intelligence have more benefits than drawbacks”
| Country | % Agreeing With Statement | GDP per capita |
|---|---|---|
| China | 78% | $12,556 |
| Saudi Arabia | 76% | $23,186 |
| India | 71% | $2,257 |
| Peru | 70% | $6,622 |
| Malaysia | 65% | $11,109 |
| Mexico | 65% | $10,046 |
| Colombia | 64% | $6,104 |
| Chile | 63% | $16,265 |
| South Korea | 62% | $34,998 |
| Türkiye | 60% | $9,661 |
| Brazil | 57% | $7,507 |
| South Africa | 57% | $7,055 |
| Argentina | 55% | $10,636 |
| Russia | 53% | $12,195 |
| Spain | 53% | $30,104 |
| Italy | 50% | $35,658 |
| Hungary | 49% | $18,728 |
| Poland | 48% | $18,000 |
| Japan | 42% | $39,313 |
| Sweden | 40% | $61,029 |
| Belgium | 38% | $51,247 |
| UK | 38% | $46,510 |
| Australia | 37% | $60,443 |
| Germany | 37% | $51,203 |
| United States | 35% | $70,249 |
| Netherlands | 33% | $57,768 |
| Canada | 32% | $51,988 |
| France | 31% | $43,659 |
GDP per capita as of 2021. Source: World Bank
Ipsos notes that their samples from developing economies like China and India were “more urban, more educated, and more affluent than the general population”. Thus, the results for these countries likely reflect the more tech-savvy segments of their population.
Further Survey Results
Respondents were asked additional questions about AI, which we’ve included in the tables below. Let’s start with this statement:
“Products and services using artificial intelligence make my life easier”
| Country | % Agreeing With Statement | GDP per capita |
|---|---|---|
| China | 87% | $12,556 |
| Saudi Arabia | 80% | $23,186 |
| Peru | 74% | $6,622 |
| South Korea | 74% | $34,998 |
| Mexico | 73% | $10,046 |
| India | 72% | $2,257 |
| Colombia | 71% | $6,104 |
| Malaysia | 71% | $11,109 |
| Türkiye | 71% | $9,661 |
| Chile | 70% | $16,265 |
| South Africa | 67% | $7,055 |
| Brazil | 65% | $7,507 |
| Russia | 64% | $12,195 |
| Argentina | 59% | $10,636 |
| Spain | 59% | $30,104 |
| Poland | 58% | $18,000 |
| Italy | 54% | $35,658 |
| Japan | 52% | $39,313 |
| Hungary | 50% | $18,728 |
| Belgium | 49% | $51,247 |
| Netherlands | 47% | $57,768 |
| Australia | 46% | $60,443 |
| Sweden | 46% | $61,029 |
| Germany | 45% | $51,203 |
| UK | 45% | $46,510 |
| Canada | 44% | $51,988 |
| United States | 41% | $70,249 |
| France | 39% | $43,659 |
As expected, we see a similar trend as in the previous question’s results. It seems that developing countries are embracing AI to greater lengths.
Next, we’ll look at a more forward-looking statement:
“Products and services using AI will profoundly change my daily life in the next 3-5 years”.
| Country | % Agreeing With Statement | GDP per capita |
|---|---|---|
| China | 80% | $12,556 |
| Saudi Arabia | 80% | $23,186 |
| South Korea | 76% | $34,998 |
| India | 74% | $2,257 |
| Türkiye | 73% | $9,661 |
| South Africa | 72% | $7,055 |
| Malaysia | 71% | $11,109 |
| Peru | 71% | $6,622 |
| Chile | 67% | $16,265 |
| Colombia | 65% | $6,104 |
| Mexico | 65% | $10,046 |
| Brazil | 61% | $7,507 |
| Argentina | 60% | $10,636 |
| Russia | 60% | $12,195 |
| Poland | 56% | $18,000 |
| Spain | 56% | $30,104 |
| Hungary | 55% | $18,728 |
| Italy | 53% | $35,658 |
| Japan | 53% | $39,313 |
| Netherlands | 53% | $57,768 |
| Belgium | 52% | $51,247 |
| Australia | 50% | $60,443 |
| Sweden | 50% | $61,029 |
| UK | 46% | $46,510 |
| United States | 46% | $70,249 |
| France | 45% | $43,659 |
| Canada | 44% | $51,988 |
| Germany | 44% | $51,203 |
Once again, populations from wealthier countries are at the lower end of the results. This could be due to societal factors (differing attitudes towards technology), economic structure, or some combination of both.
To elaborate on economic structure, let’s look at the world’s two biggest economies, the U.S. and China. The following table shows the distribution of each country’s workforce across the three major sectors.
| Economic Sector | U.S. | China |
|---|---|---|
| Agriculture | 1% | 25% |
| Industry | 20% | 28% |
| Services | 79% | 47% |
As of 2019. Source: Statista
Developing economies such as China have a larger proportion of agricultural and industrial employment, while advanced economies like the U.S. are typically more services oriented. Structural differences such as these could have an impact on how a population views AI.
-

 Misc2 weeks ago
Ranked: Top 10 Cities Where International Travelers Spend the Most
-
 Environment4 weeks ago
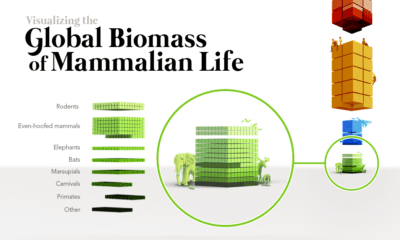
Visualizing the Biomass of All the World’s Mammals
-
 VC+2 weeks ago
Coming Soon: Here’s What’s Coming to VC+ Next
-
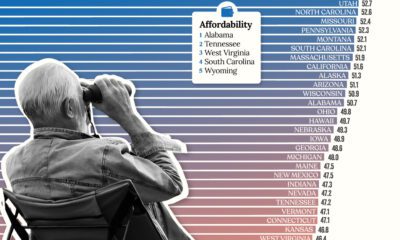
 Personal Finance3 weeks ago
Ranked: The Best U.S. States for Retirement
-

 Economy1 week ago
Visualizing the American Workforce as 100 People
-

 Commodities3 weeks ago
Charted: Commodities vs Equity Valuations (1970–2023)
-

 Batteries1 week ago
How EV Adoption Will Impact Oil Consumption (2015-2025P)
-
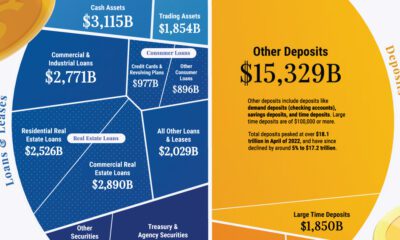
 Money3 weeks ago
Visualizing the Assets and Liabilities of U.S. Banks