Misc
The History of the FIFA Women’s World Cup
Article/Editing:
Click to view a higher resolution version of this graphic.
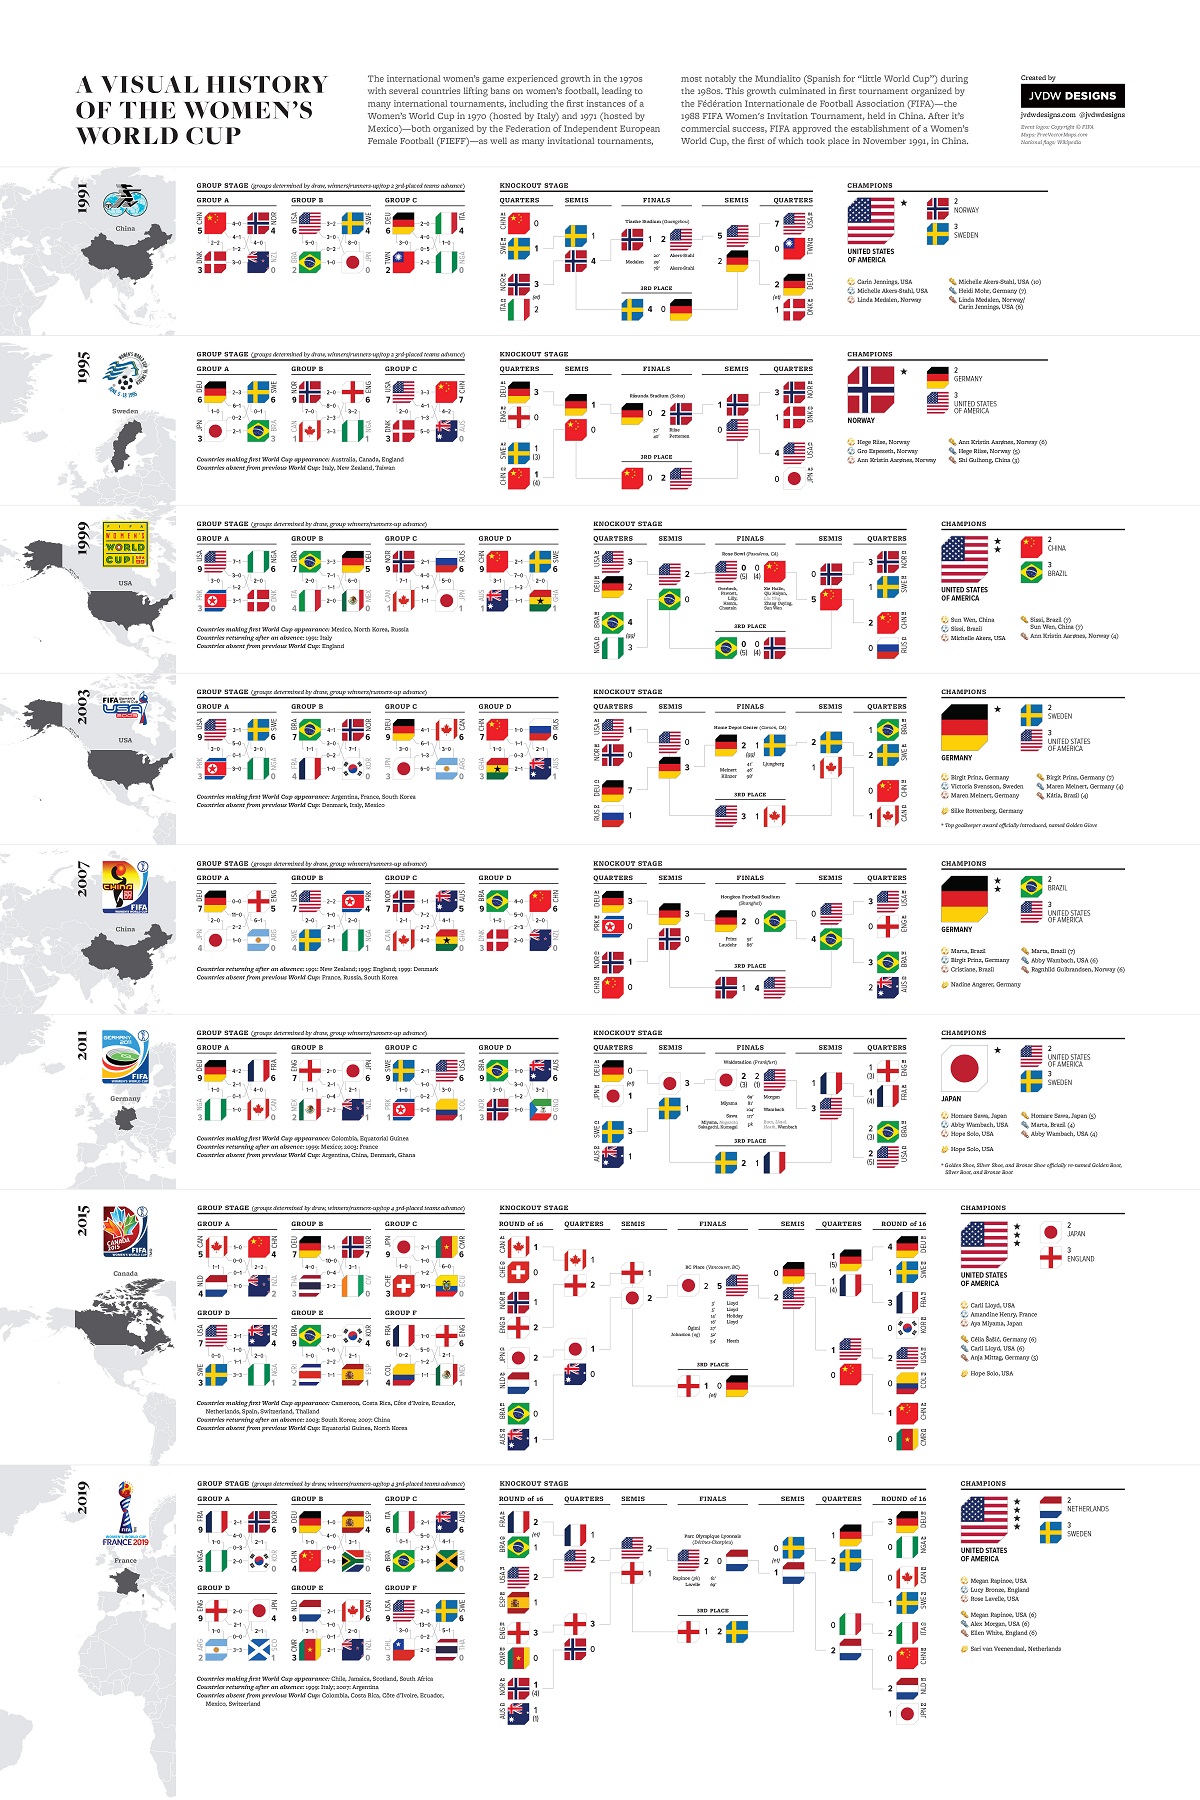
FIFA Women’s World Cup Timeline: 1991‒2019
The ninth edition of the FIFA Women’s World Cup that kicked off this summer in Australia and New Zealand is expected to break records.
For the first time, 32 teams are competing at the premier international event for women’s soccer, up from 24 teams in the two prior editions. And according to FIFA, the tournament is already on pace to become the most attended women’s sports event in history, with over a million tickets already sold.
Eight countries are making their debut in the tournament after qualifying for the first time:
- 🇵🇭 Philippines
- 🇮🇪 Ireland
- 🇿🇲 Zambia
- 🇭🇹 Haiti
- 🇻🇳 Vietnam
- 🇵🇹 Portugal
- 🇵🇦 Panama
- 🇲🇦 Morocco
How has the tournament grown?
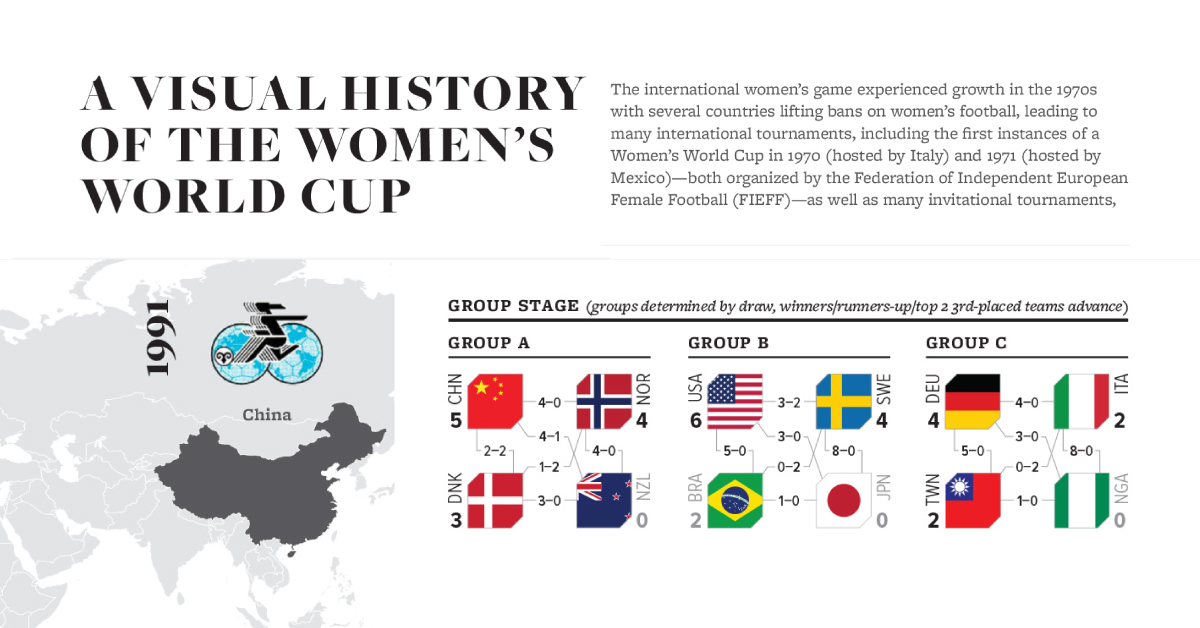
This graphic created by JVDW Designs explores the timeline of this tournament, from its origins with only 12 teams in 1991 to expansions during the 21st century.
The Origins of Women’s Soccer
Though there are reports of women’s soccer matches as early as the 1700s, the sport started to grow in popularity in 1895 thanks to the British Ladies’ Football Club (BLFC), one of the first women’s soccer clubs.
Despite receiving no support from soccer associations in the UK, the club held its inaugural match in London and then went on tour. They received a lot of attention in the press, both due to the sport itself and debates in Victorian England over women’s rights.

After gaining in popularity over the next decades and even drawing bigger crowds than men’s matches, England’s governing soccer association retaliated by banning women’s soccer in 1921. The stated reason was that “the game of football is quite unsuitable for females and ought not to be encouraged.”
Other countries followed suit over time, sidelining women’s soccer from France to Brazil. It wasn’t until the success of the 1966 Men’s World Cup in England, which set records for attendance and was the first to be broadcast to other continents, that England and then other countries in Europe re-established women’s soccer due to increased interest.
The FIFA Women’s World Cup
After multiple international tournaments in the 1970s and 1980s, FIFA finally organized the inaugural FIFA Women’s World Cup in China in 1991.
At the outset, the athletes participating in the Women’s World Cup were not treated as professionals. In her 2019 book, sports journalist Caitlyn Murray details that uniforms were sometimes hand-me-downs from men’s teams, and accommodations during travel were far from luxurious. Notably, the tournament also lacked prize money until 2007.
In total, 35 different national teams have participated in at least one of the eight tournaments held through 2019. Here is the full list, with host countries noted in bold:
| Country | Women's World Cups Attended |
|---|---|
| 🇺🇸 United States | 1991, 1995,1999, 2003, 2007, 2011, 2015, 2019 |
| 🇸🇪 Sweden | 1991, 1995, 1999, 2003, 2007, 2011, 2015, 2019 |
| 🇧🇷 Brazil | 1991, 1995, 1999, 2003, 2007, 2011, 2015, 2019 |
| 🇳🇴 Norway | 1991, 1995, 1999, 2003, 2007, 2011, 2015, 2019 |
| 🇩🇪 Germany | 1991, 1995, 1999, 2003, 2007, 2011, 2015, 2019 |
| 🇯🇵 Japan | 1991, 1995, 1999, 2003, 2007, 2011, 2015, 2019 |
| 🇳🇬 Nigeria | 1991, 1995, 1999, 2003, 2007, 2011, 2015, 2019 |
| 🇨🇳 China | 1991, 1995, 1999, 2003, 2007, 2015, 2019 |
| 🇨🇦 Canada | 1995, 1999, 2003, 2007, 2011, 2015, 2019 |
| 🇦🇺 Australia | 1995, 1999, 2003, 2007, 2011, 2015, 2019 |
| 🇳🇿 New Zealand | 1991, 2007, 2011, 2015, 2019 |
| 🏴 England | 1995, 2007, 2011, 2015, 2019 |
| 🇩🇰 Denmark | 1991, 1995, 1999, 2007 |
| 🇰🇵 North Korea | 1999, 2003, 2007, 2011 |
| 🇫🇷 France | 2003, 2011, 2015, 2019 |
| 🇮🇹 Italy | 1991, 1999, 2019 |
| 🇲🇽 Mexico | 1999, 2011, 2015 |
| 🇦🇷 Argentina | 2003, 2007, 2019 |
| 🇰🇷 South Korea | 2003, 2015, 2019 |
| 🇷🇺 Russia | 1999, 2003 |
| 🇨🇴 Colombia | 2011, 2015 |
| 🇨🇲 Cameroon | 2015, 2019 |
| 🇳🇱 Netherlands | 2015, 2019 |
| 🇪🇸 Spain | 2015, 2019 |
| 🇹🇭 Thailand | 2015, 2019 |
| 🇹🇼 Taiwan | 1991 |
| 🇬🇶 Equatorial Guinea | 2011 |
| 🇨🇷 Costa Rica | 2015 |
| 🇨🇮 Côte d'Ivoire | 2015 |
| 🇪🇨 Ecuador | 2015 |
| 🇨🇭 Switzerland | 2015 |
| 🇨🇱 Chile | 2019 |
| 🇯🇲 Jamaica | 2019 |
| 🏴 Scotland | 2019 |
| 🇿🇦 South Africa | 2019 |
From the onset, the U.S. emerged as dominant forces in the women’s game. They won the inaugural official tournament in 1991 and are one of just seven countries that have qualified for each edition of the Women’s World Cup from 1991 to 2019.
In total, the American side has won four FIFA Women’s World Cups so far. Throughout the tournament’s history, they’ve never finished lower than third place.
| Country | Championships |
|---|---|
| 🇺🇸 United States | 4 |
| 🇩🇪 Germany | 2 |
| 🇳🇴 Norway | 1 |
| 🇯🇵 Japan | 1 |
The all-time leading World Cup goal scorer, however, comes from Brazil. Marta Vieira da Silva, or “Queen Marta,” etched her name in history by scoring an impressive 17 goals across five World Cups for Brazil, surpassing the men’s World Cup goalscoring record of 16 goals.
As the ninth edition unfolds, the tournament’s growth and global appeal continue to soar. With an even brighter future in the cards for women’s soccer, the question remains: who will come out on top in the 2023 Women’s World Cup?

This article was published as a part of Visual Capitalist's Creator Program, which features data-driven visuals from some of our favorite Creators around the world.


Urbanization
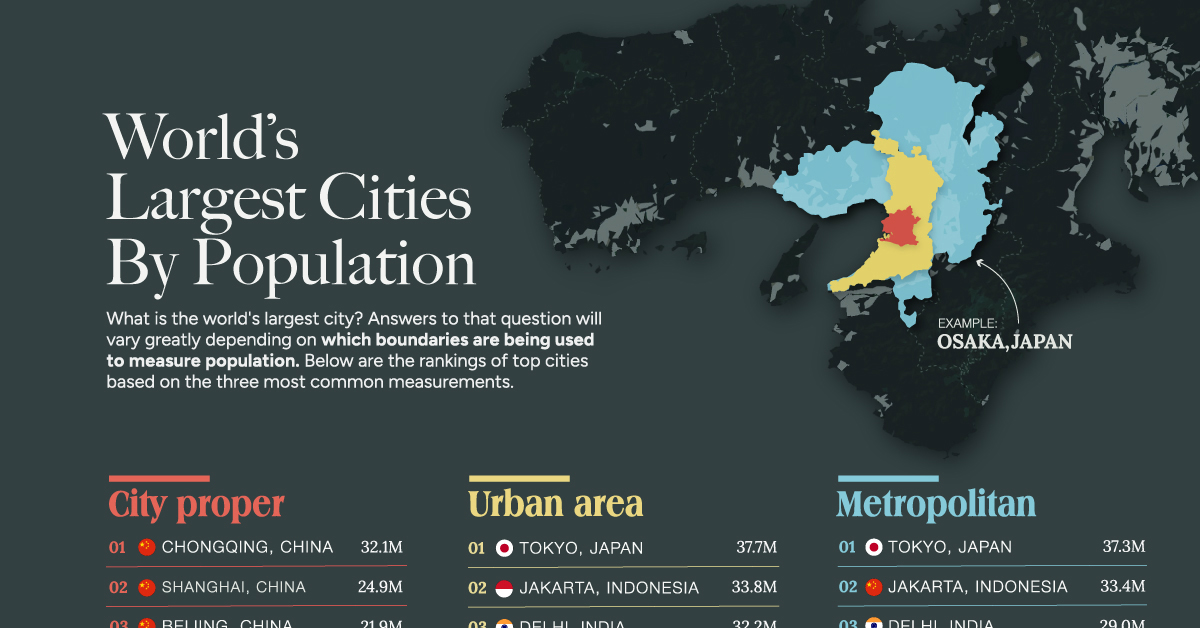
Ranked: The World’s Largest Cities By Population
This graphic uses data taken from latest official censuses and projections to rank the largest cities by population.
Ranked: The World’s Largest Cities By Population
The world has experienced rapid urbanization over the last century.
Today, more than 4.3 billion people live in urban settings, or 55% of the world’s population.
But what is the world’s largest city? Answers to that question will vary greatly depending on which lines are being used to demarcate city boundaries and measure their populations.
The graphic above uses data taken from the latest official censuses and projections to rank the top cities based on the three most common metrics.
The Largest Cities by City Proper
Our first metric is based on the city proper, meaning the administrative boundaries.
According to the United Nations, a city proper is “the single political jurisdiction which contains the historical city center.”
The Chinese city of Chongqing leads the ranks by this metric and has an administrative boundary the size of Austria, with an urban population of 32.1 million.
The city’s monorail system holds records for being the world’s longest and busiest, boasting 70 stations. Chongqing Jiangbei International Airport, is among the world’s top 50 busiest airports. Additionally, the city ranks among the globe’s top 50 hubs for scientific research.
Other Chinese cities dominate the ranking by this metric:
| Rank | City | Population (Million) |
|---|---|---|
| #1 | 🇨🇳 Chongqing | 32.1m |
| #2 | 🇨🇳 Shanghai | 24.9m |
| #3 | 🇨🇳 Beijing | 21.9m |
| #4 | 🇮🇳 Delhi | 16.8m |
| #5 | 🇨🇳 Chengdu | 16.0m |
| #6 | 🇹🇷 Istanbul | 15.5m |
| #7 | 🇵🇰 Karachi | 14.9m |
| #8 | 🇨🇳 Guangzhou | 14.5m |
| #9 | 🇨🇳 Tianjin | 13.9m |
| #10 | 🇯🇵 Tokyo | 13.5m |
The first non-Chinese city, Delhi, has been experiencing one of the fastest urban expansions in the world.
The United Nations projects India will add over 400 million urban dwellers by 2050, compared to 250 million people in China and 190 million in Nigeria.
The Largest Cities by Urban Area
This measurement largely ignores territorial boundaries and considers a city a contiguous, connected built-up area.
Demographia describes urban areas as functioning as an integrated economic unit, linked by commuting flows, social, and economic interactions.
By this metric, Tokyo leads the ranking:
| Rank | City | Population (Million) |
|---|---|---|
| #1 | 🇯🇵 Tokyo | 37.7m |
| #2 | 🇮🇩 Jakarta | 33.8m |
| #3 | 🇮🇳 Delhi | 32.2m |
| #4 | 🇨🇳 Guangzhou | 26.9m |
| #5 | 🇮🇳 Mumbai | 25.0m |
| #6 | 🇵🇭 Manila | 24.9m |
| #7 | 🇨🇳 Shanghai | 24.1m |
| #8 | 🇧🇷 Sao Paulo | 23.1m |
| #9 | 🇰🇷 Seoul | 23.0m |
| #10 | 🇲🇽 Mexico City | 21.8m |
The city proper houses about 10% of Japan’s population. If the greater Tokyo metro area is considered, including cities like Kanagawa, Saitama, and Chiba, then Tokyo’s total population surpasses 37 million—about 30% of the country total.
Consequently, even with one of the world’s largest railway systems, trains in Tokyo are incredibly crowded, with a boarding rate of 200% during peak time in the most overcrowded areas. The city is also famous for its Shibuya Crossing, the busiest intersection on the planet.
The Largest Cities by Metropolitan Area
Tokyo also leads by our final metric, metropolitan area.
This measurement is similar to urban area, but is generally defined by official organizations, either for statistical purposes or governance.
In the United States, this takes the form of metropolitan statistical areas (MSAs), such as Chicago-Naperville-Elgin or Phoenix-Mesa-Chandler.
| Rank | City | Population (Million) |
|---|---|---|
| #1 | 🇯🇵 Tokyo | 37.3m |
| #2 | 🇮🇩 Jakarta | 33.4m |
| #3 | 🇮🇳 Delhi | 29.0m |
| #4 | 🇰🇷 Seoul | 25.5m |
| #5 | 🇮🇳 Mumbai | 24.4m |
| #6 | 🇲🇽 Mexico City | 21.8m |
| #7 | 🇧🇷 Sao Paulo | 21.7m |
| #8 | 🇳🇬 Lagos | 21.0m |
| #9 | 🇺🇸 New York | 20.1m |
| #10 | 🇷🇺 Moscow | 20.0m |
As the global urban population continues to rise, new cities, especially in Africa and Asia, are expected to vie for the “largest” tag soon.
The UN projects that by 2050, 68% of the world will live in urban areas.

-

 VC+7 days ago
Lifetime VC+ Subscription – One-time Offer Expires Aug 24, 2023
-
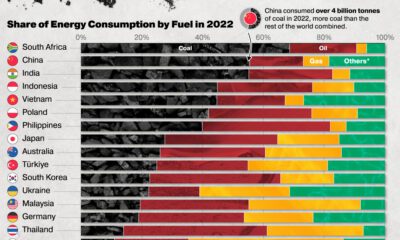
 Green3 weeks ago
Which Countries Are Most Reliant on Coal?
-

 Environment6 days ago
Visualizing the Global Population by Water Security Levels
-
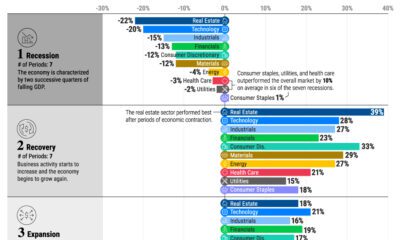
 Markets2 weeks ago
The Top Performing S&P 500 Sectors Over the Business Cycle
-

 Misc6 days ago
12 Different Ways to Organize the Periodic Table of Elements
-

 Debt2 weeks ago
Animated: Global Debt Projections (2005-2027P)
-
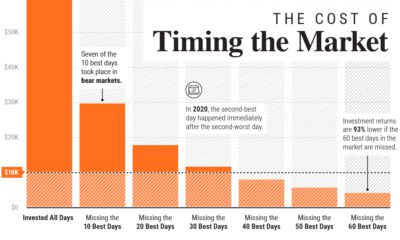
 Markets3 days ago
Timing the Market: Why It’s So Hard, in One Chart
-

 Misc4 weeks ago
Ranked: The World’s Most Valuable Football Club Brands