Technology
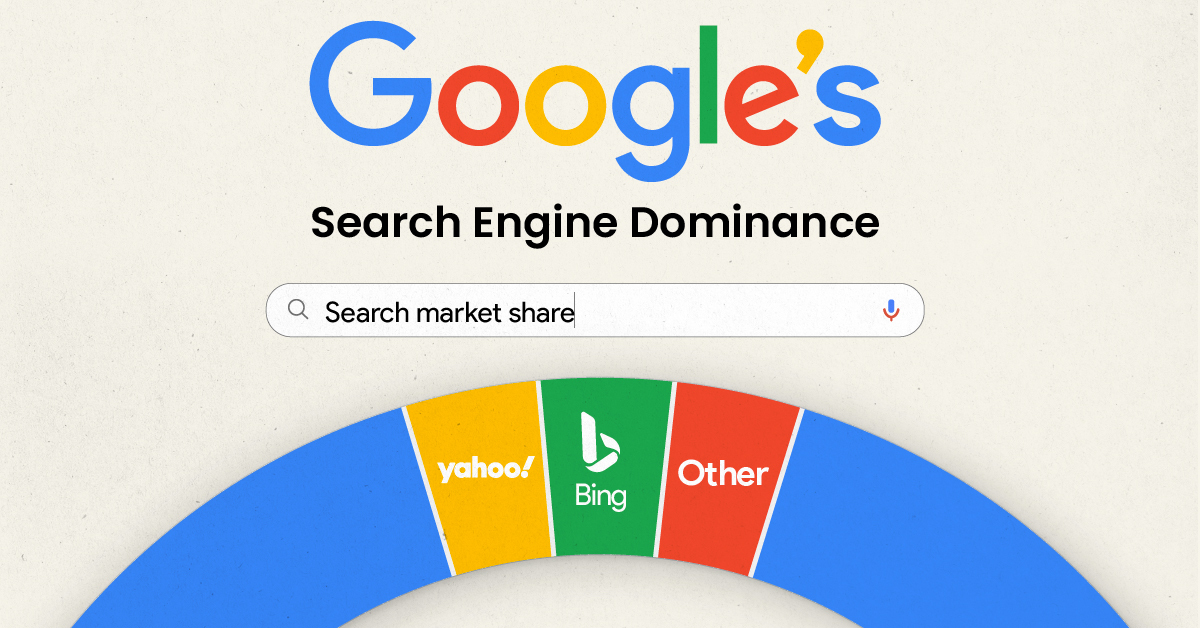
Visualizing Google’s Search Engine Market Share
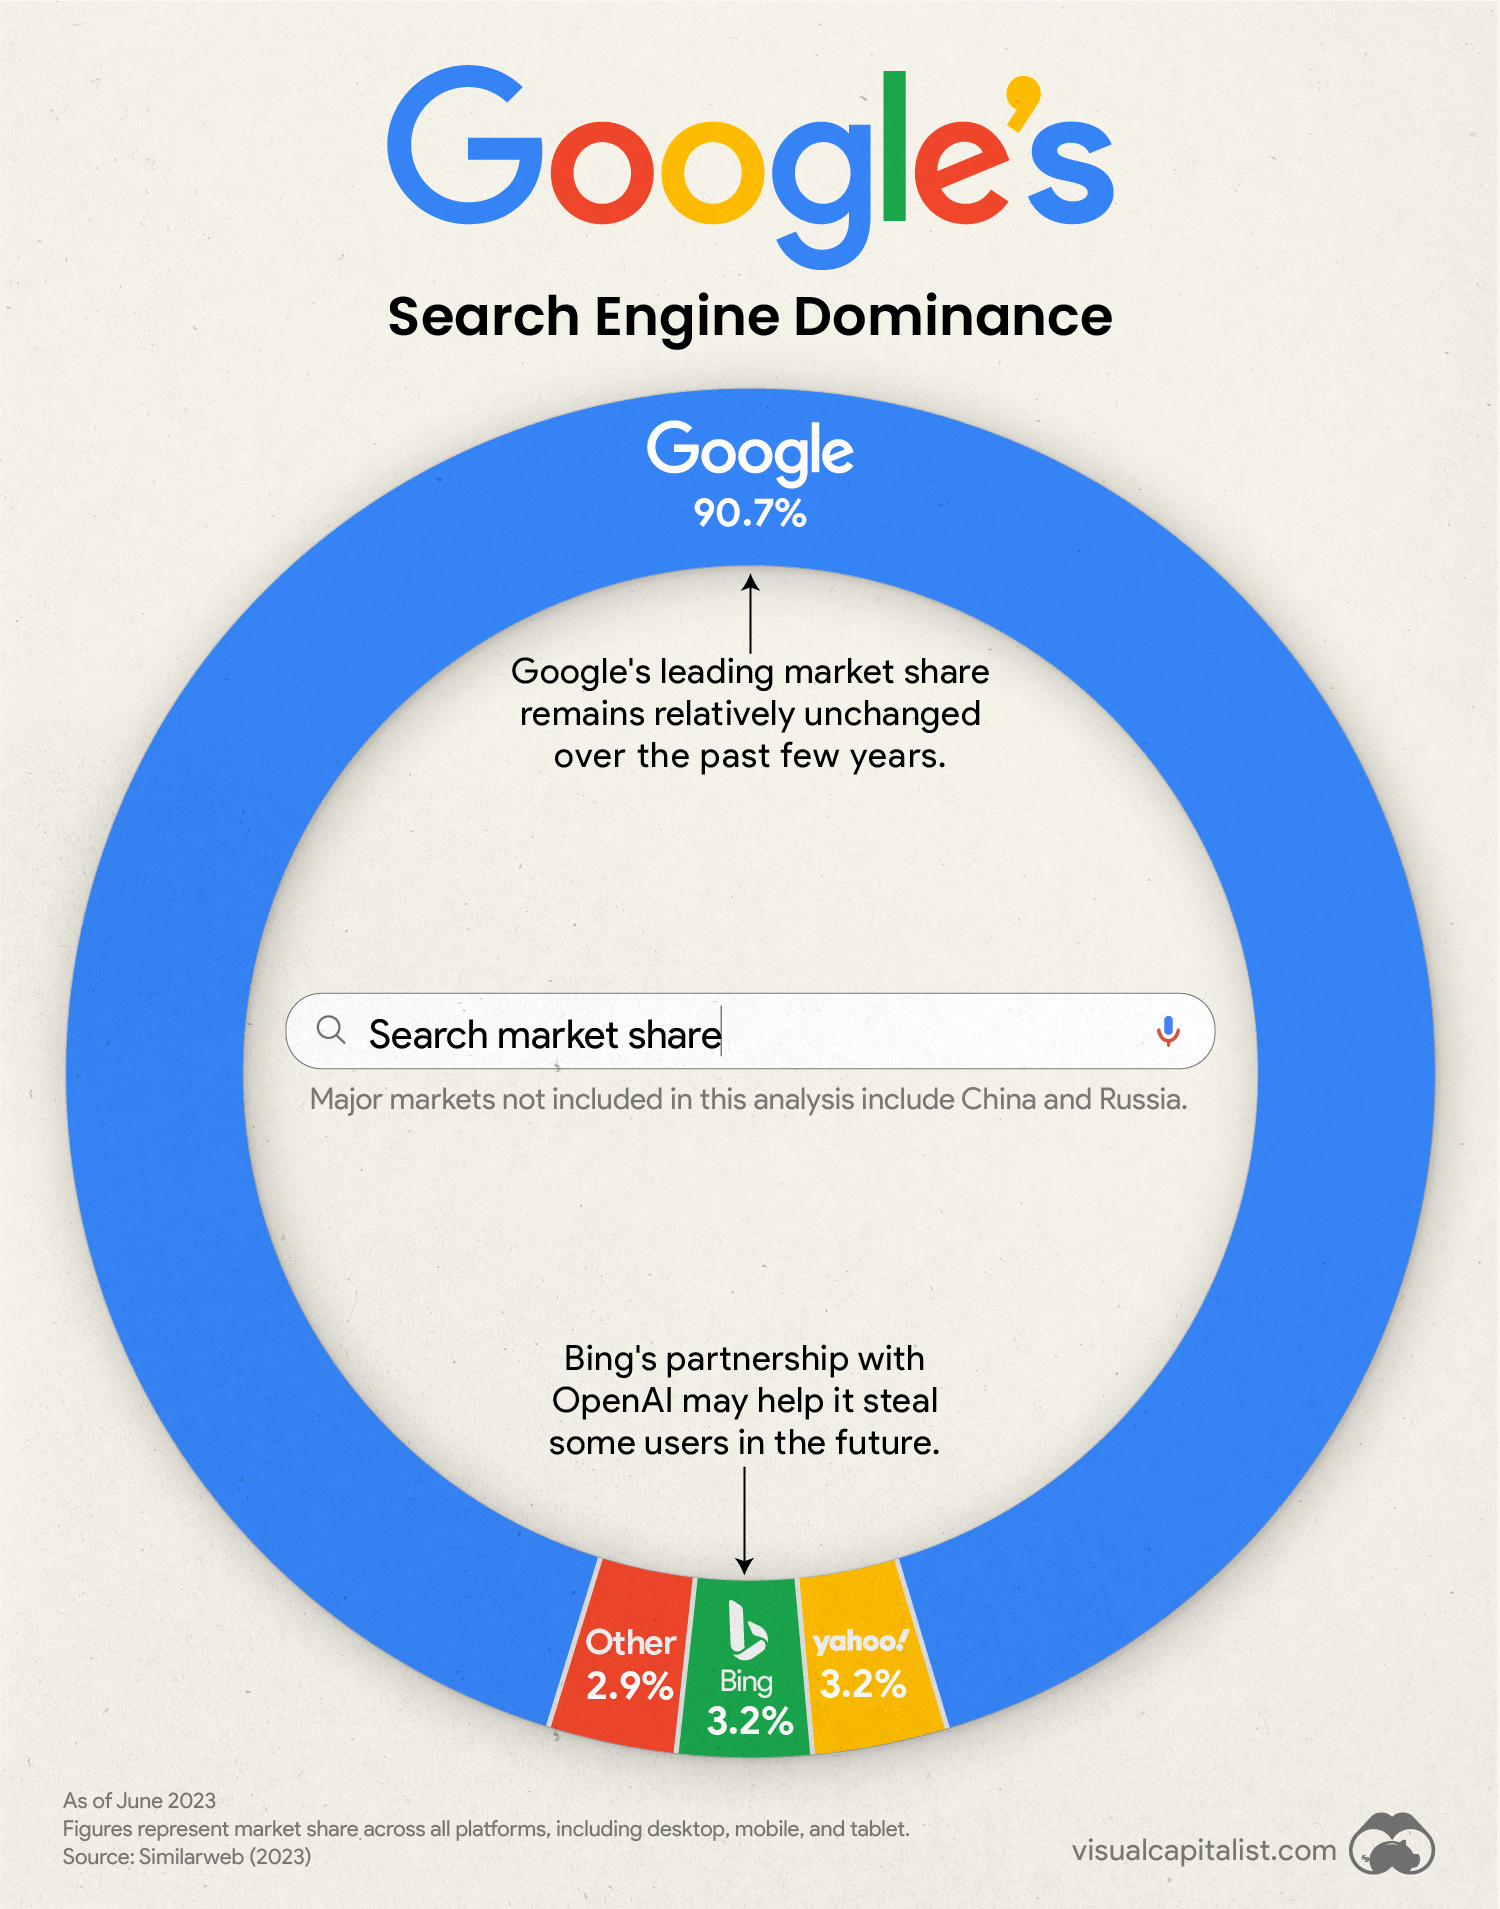
Visualizing Google’s Search Engine Dominance
Google is ubiquitous in the daily lives of billions of people around the world, with leading positions in online search, maps, and other services.
In fact, Google’s dominance is so far-reaching, it has led the U.S. Justice Department to launch a civil antitrust lawsuit for what it believes are examples of anticompetitive and exclusionary conduct.
This graphic, which uses data from Similarweb, shows the scale of Google’s lead over major search engine competitors like Bing and Yahoo.
Global Search Engine Market Share
The data we used to create this graphic is provided in the table below. It is global search engine market share as of June 2023, across all platforms (desktop, mobile, and tablet).
Note that this analysis does not include China, where Google and other American tech firms are currently banned, or Russia, where Google has ceased operations.
| Search Engine | Global Market Share (%) |
|---|---|
| 90.7% | |
| Bing | 3.2% |
| Yahoo | 3.2% |
| Other | 2.9% |
The largest player included in “Other” is South Korea’s Naver (0.48% global market share), which is similar to Google in that it offers a plethora of online services like search, video, and mobile payments.
Google Prepares for its U.S. Lawsuit
In January 2023, the U.S. Justice Department announced a civil antitrust lawsuit against Google for monopolizing digital advertising technologies.
Today’s complaint alleges that Google has used anticompetitive, exclusionary, and unlawful conduct to eliminate or severely diminish any threat to its dominance over digital advertising technologies
Merrick B. Garland, Attorney General
The Justice Department originally made several antitrust arguments. Potential actions that were deemed red flags include setting Google as a default mobile browser on Android phones, designing search results to disadvantage competitors, and the company’s ongoing partnership with Apple for its Safari browser. That said, some of the less substantial claims have since been dismissed by Judge Amit Mehta.
Google’s court case will begin in mid-September, marking the biggest tech monopoly trial since United States v. Microsoft Corp in 2001. Google is expected to argue that it simply offers a superior product.
Can Bing Challenge Google on Home Turf?
To answer this question, let’s look at U.S. market share over the past 12 months ending June 2023.
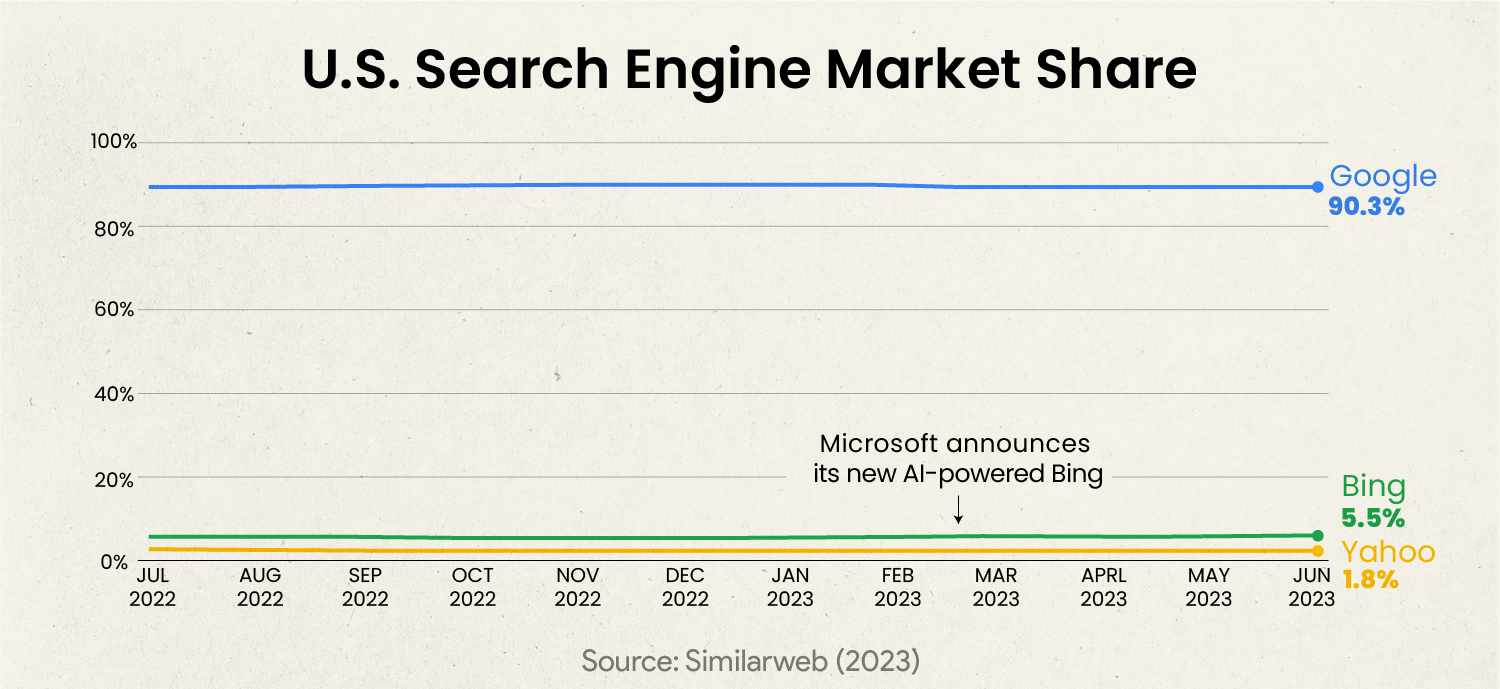
From this chart we can see that Bing maintains a slightly higher 5.5% U.S. market share (versus 3.2% globally).
The biggest takeaway from this chart, though, is that Bing does not appear to have gained any traction in 2023, even after releasing its latest AI-powered version in February.
The new Bing is the result of Microsoft’s $10 billion investment into OpenAI at the beginning of 2023, which allows the tech giant to incorporate the immensely popular GPT-4 into its various products and services.


AI
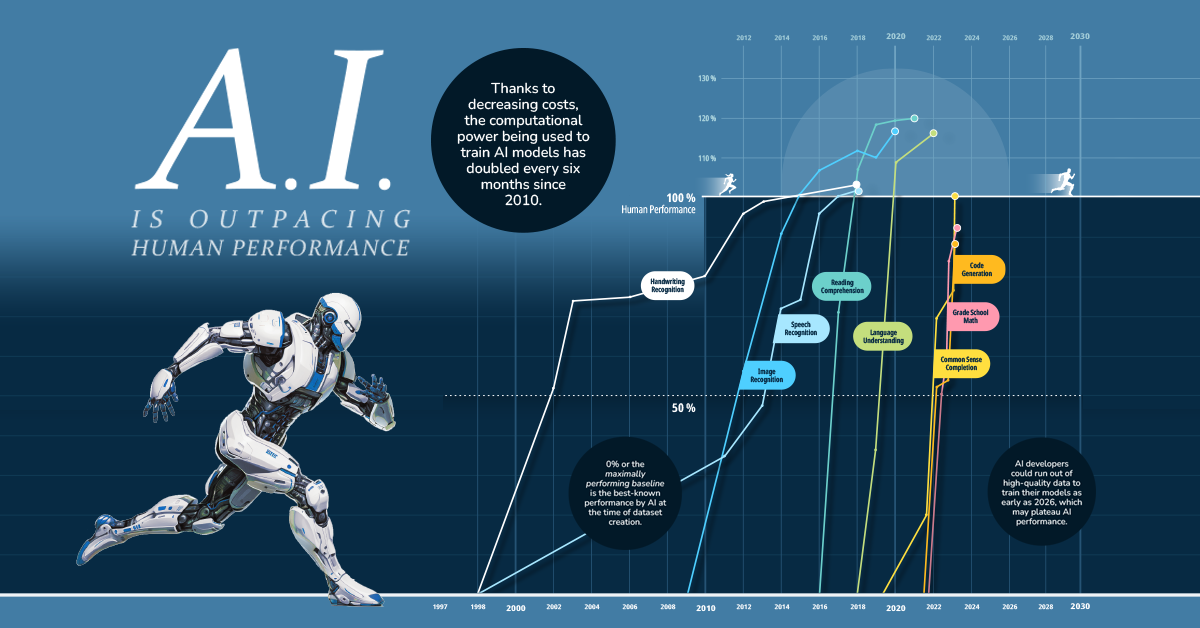
AI vs. Humans: Which Performs Certain Skills Better?
Progress in computation ability, data availability, and algorithm efficiency has led to rapid gains in performance for AI vs humans.
AI vs. Humans: Which Performs Certain Skills Better?
With ChatGPT’s explosive rise, AI has been making its presence felt for the masses, especially in traditional bastions of human capabilities—reading comprehension, speech recognition and image identification.
In fact, in the chart above it’s clear that AI has surpassed human performance in quite a few areas, and looks set to overtake humans elsewhere.
How Performance Gets Tested
Using data from Contextual AI, we visualize how quickly AI models have started to beat database benchmarks, as well as whether or not they’ve yet reached human levels of skill.
Each database is devised around a certain skill, like handwriting recognition, language understanding, or reading comprehension, while each percentage score contrasts with the following benchmarks:
- 0% or “maximally performing baseline”
This is equal to the best-known performance by AI at the time of dataset creation. - 100%
This mark is equal to human performance on the dataset.
By creating a scale between these two points, the progress of AI models on each dataset could be tracked. Each point on a line signifies a best result and as the line trends upwards, AI models get closer and closer to matching human performance.
Below is a table of when AI started matching human performance across all eight skills:
| Skill | Matched Human Performance | Database Used |
|---|---|---|
| Handwriting Recognition | 2018 | MNIST |
| Speech Recognition | 2017 | Switchboard |
| Image Recognition | 2015 | ImageNet |
| Reading Comprehension | 2018 | SQuAD 1.1, 2.0 |
| Language Understanding | 2020 | GLUE |
| Common Sense Completion | 2023 | HellaSwag |
| Grade School Math | N/A | GSK8k |
| Code Generation | N/A | HumanEval |
A key observation from the chart is how much progress has been made since 2010. In fact many of these databases—like SQuAD, GLUE, and HellaSwag—didn’t exist before 2015.
In response to benchmarks being rendered obsolete, some of the newer databases are constantly being updated with new and relevant data points. This is why AI models technically haven’t matched human performance in some areas (grade school math and code generation) yet—though they are well on their way.
What’s Led to AI Outperforming Humans?
But what has led to such speedy growth in AI’s abilities in the last few years?
Thanks to revolutions in computing power, data availability, and better algorithms, AI models are faster, have bigger datasets to learn from, and are optimized for efficiency compared to even a decade ago.
This is why headlines routinely talk about AI language models matching or beating human performance on standardized tests. In fact, a key problem for AI developers is that their models keep beating benchmark databases devised to test them, but still somehow fail real world tests.
Since further computing and algorithmic gains are expected in the next few years, this rapid progress is likely to continue. However, the next potential bottleneck to AI’s progress might not be AI itself, but a lack of data for models to train on.

-

 Wealth4 weeks ago
Visualizing $156 Trillion in U.S. Assets, by Generation
-
 China2 weeks ago
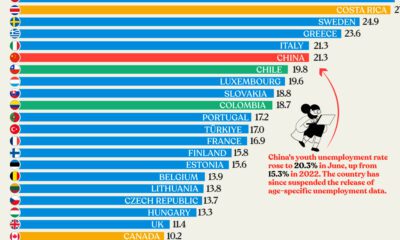
Charted: Youth Unemployment in the OECD and China
-
 Markets3 weeks ago
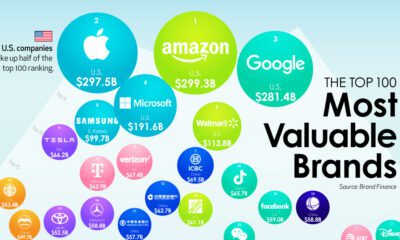
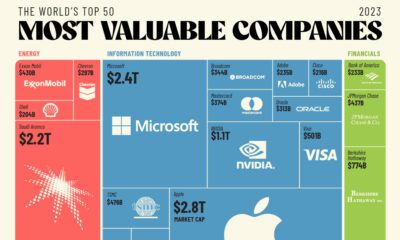
The 50 Most Valuable Companies in the World in 2023
-
 Markets2 weeks ago
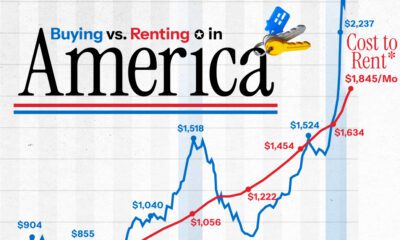
The Monthly Cost of Buying vs. Renting a House in America
-

 Markets3 weeks ago
Visualized: U.S. Corporate Bankruptcies On the Rise
-

 Sports1 week ago
Ranked: The World’s Largest Stadiums
-
 Globalization3 weeks ago
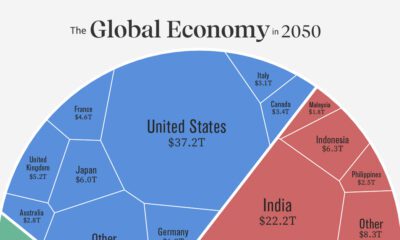
Visualizing the Future Global Economy by GDP in 2050
-
 Markets7 days ago
Charted: Six Red Flags Pointing to China’s Economy Slowing Down