Green
The 2023 Utility Decarbonization Index

The 2023 Utility Decarbonization Index
This was originally posted on the Decarbonization Channel. Subscribe to the free mailing list to be the first to see graphics related to decarbonization with a focus on the U.S. energy sector.
Electric utilities and the power sector have a pivotal role to play in decarbonizing the U.S. economy, especially with the electrification of sectors such as transportation.
So, where do the country’s largest electricity producers stand on the path to decarbonization?
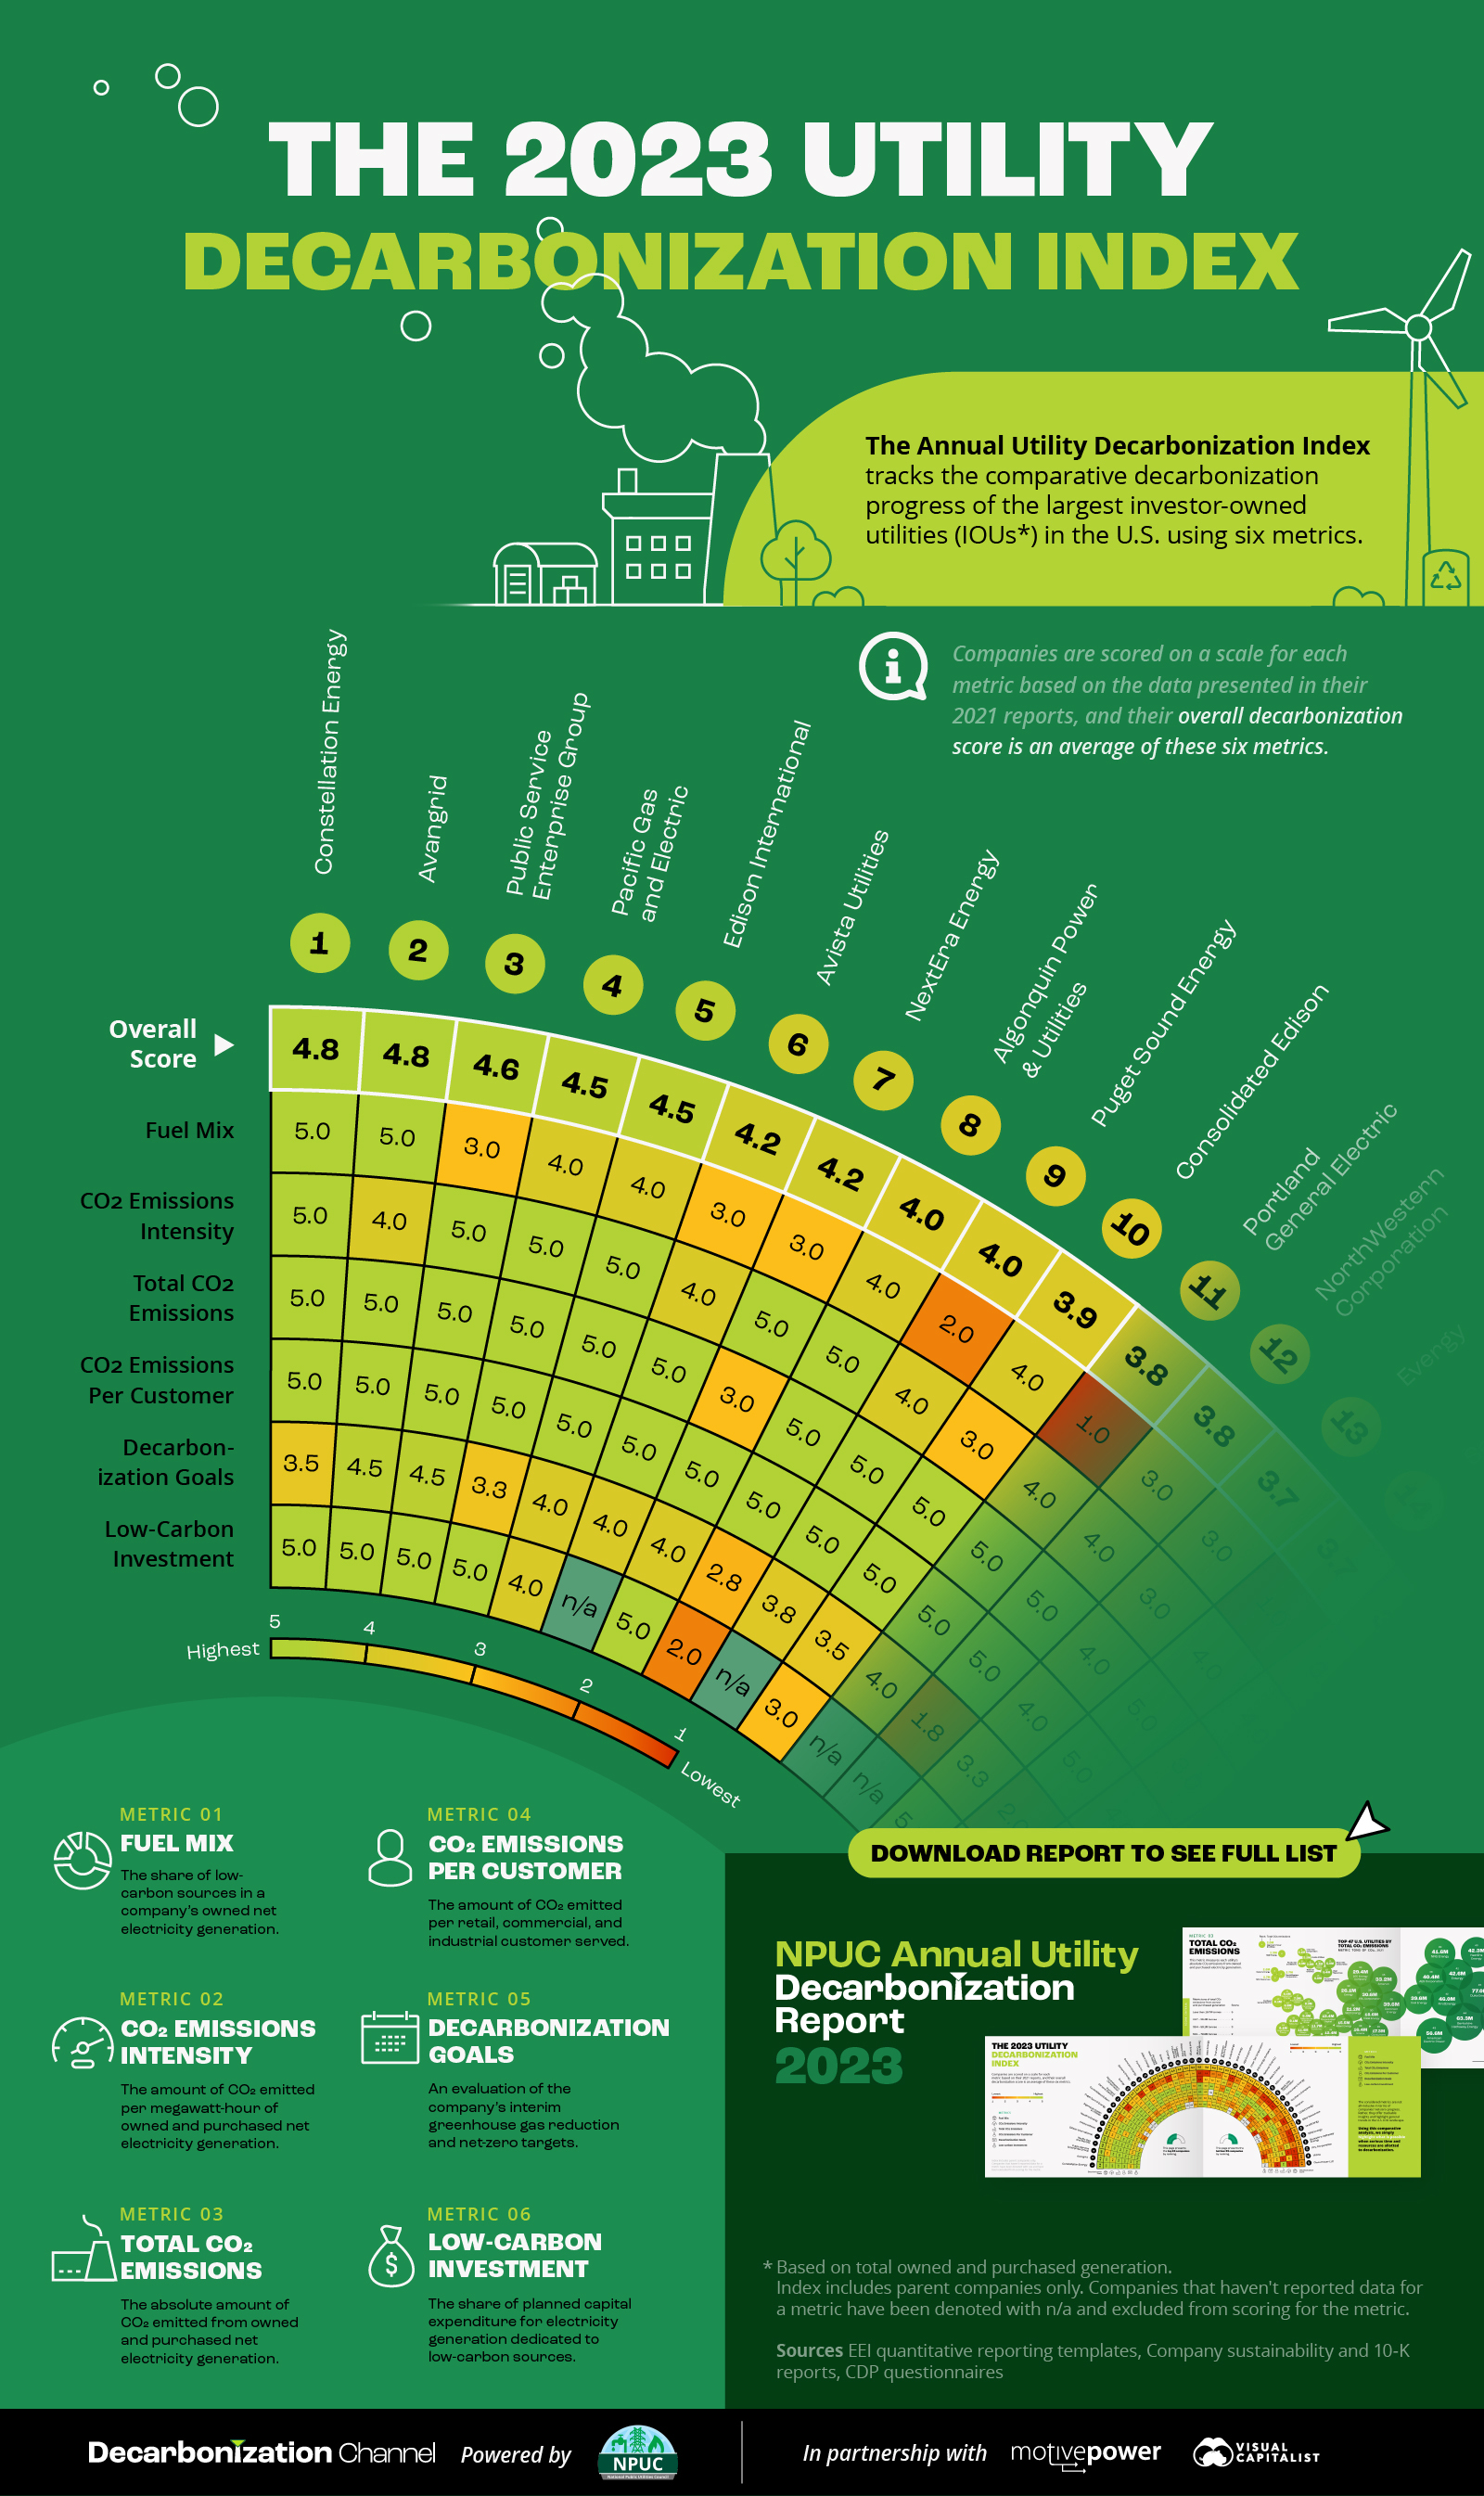
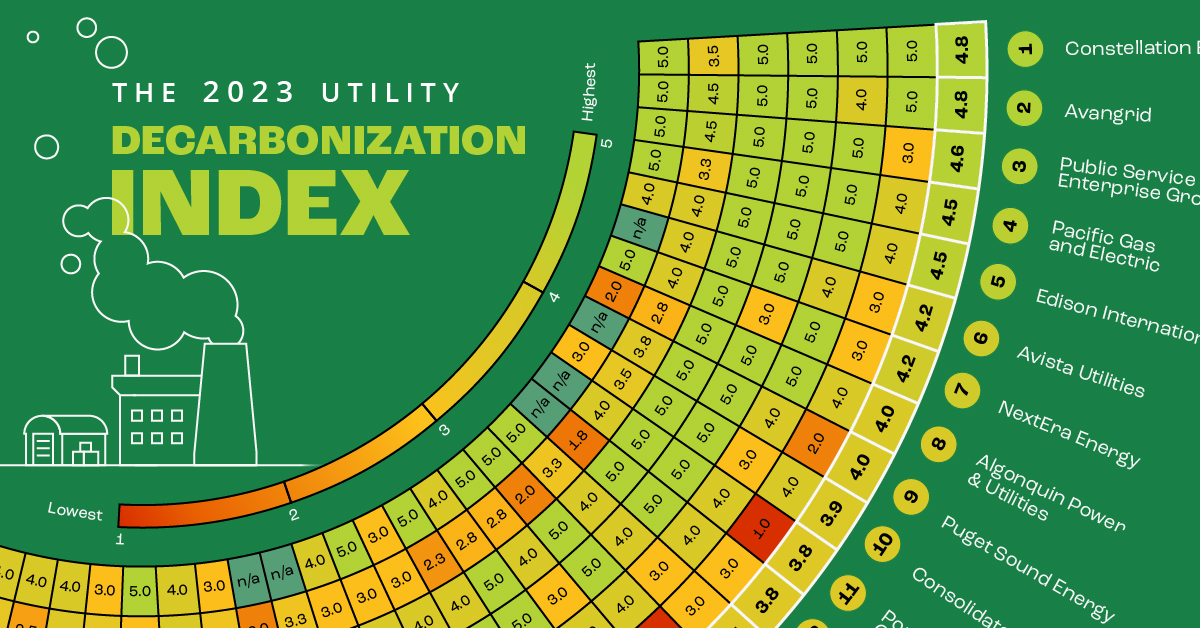
In collaboration with our sponsor National Public Utilities Council, we present the 2023 edition of our Annual Utility Decarbonization Index. The index uses 2021 data (the latest available at the time of data collection) to track the comparative decarbonization progress of the 47 largest investor-owned utilities (IOUs) in the United States.
In the graphic above, we give a preview of the top 10 rankers.
Methodology of the Utility Decarbonization Index
The Utility Decarbonization Index uses the following six metrics to track decarbonization progress:
- Fuel Mix
The share of low-carbon sources in a utility’s owned net electricity generation. - CO2 Emissions Intensity
The amount of CO2 emitted per megawatt-hour of owned and purchased net electricity generation. - Total CO2 Emissions
The absolute amount of CO2 emitted from owned and purchased net electricity generation. - CO2 Emissions Per Customer
The amount of CO2 emitted per retail, commercial, and industrial customer served. - Decarbonization Goals
An evaluation of the company’s interim greenhouse gas reduction and net-zero targets, with a 50% reduction in emissions by 2030 and net-zero by 2050 as baseline targets. - Low-Carbon investment
The share of planned capital expenditure for electricity generation dedicated to low-carbon sources.
All 47 IOUs in the Decarbonization Index are scored on a scale of one (lowest) to five (highest) for each of the six metrics, indicating whether they are trailing or leading compared to their peers. A utility’s final decarbonization score is an average of its scores across the six metrics.
The data for these metrics comes from company sustainability reports, quantitative ESG reporting templates from the Edison Electric Institute, and the Climate Disclosure Project’s Climate Change Questionnaire filings.
With the methodology in mind, let’s take a look at the 10 utilities that are leading the ranking in this year’s Utility Decarbonization Index.
The Annual Utility Decarbonization Index 2023
The 47 IOUs ranked in the Index are the largest electricity producers in the country, together representing over 58% of U.S. electricity generation in 2021 and serving 68% of all US. electric customers. Therefore, the decarbonization of these utilities can have a massive impact on the power sector and other electricity-consuming sectors.
However, it’s important to note that a score of five on the Utility Decarbonization Index does not indicate full decarbonization or net-zero emissions. Rather, it indicates that the utility is leading in decarbonization relative to its peers.
Here are the top 10 IOUs in this year’s ranking:
| Rank | Company | Decarbonization score |
|---|---|---|
| #1 | Constellation Energy (Exelon) | 4.8 |
| #2 | Avangrid | 4.8 |
| #3 | Public Service Enterprise Group | 4.6 |
| #4 | Pacific Gas and Electric | 4.5 |
| #5 | Edison International (EIX) | 4.5 |
| #6 | Avista Utilities | 4.2 |
| #7 | NextEra Energy | 4.2 |
| #8 | Algonquin Power & Utilities | 4.0 |
| #9 | Puget Sound Energy (PSE) | 4.0 |
| #10 | Consolidated Edison | 3.9 |
Constellation Energy, a newly formed subsidiary of Exelon, tops this year’s Decarbonization Index along with Avangrid. Constellation is the largest low-carbon electricity producer among the 47 IOUs, with 80% of its owned net electricity generation coming from nuclear power plants. The company also had the lowest CO2 emissions intensity of all utilities in the Index.
Avangrid, a clean energy-focused utility operating in the Northeast, ties for first place thanks to its low-carbon fuel mix and ambitious decarbonization targets to achieve carbon neutrality in Scope 1 and 2 emissions by 2030.
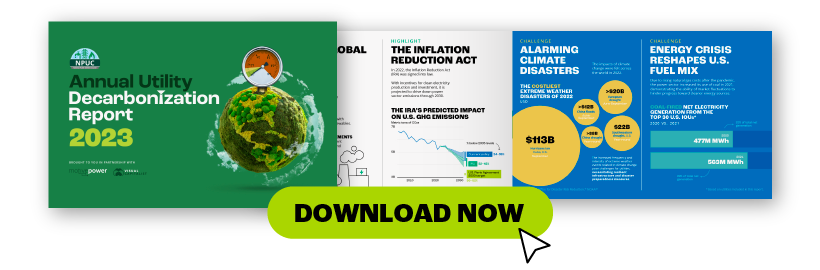
Download the 2023 Annual Utility Decarbonization Report
Are you interested in seeing the rest of the rankings? Check out the full report!
In addition to the Decarbonization Index, there’s much more to unpack, including:
- Six reasons why utilities must decarbonize
- Highlights and challenges to decarbonization from 2021–2022
- The data behind the six individual metrics
- The U.S. Utilities ESG report card
- Decarbonization strategies for U.S. utilities
Download the 2023 NPUC Annual Utility Decarbonization Report and find out everything you need to know about utility decarbonization.


Green
Visualized: Air Quality and Pollution in 50 Capital Cities
This visual compares air quality in 50 capital cities around the world by average PM2.5 concentrations in 2022.
 Creator Program
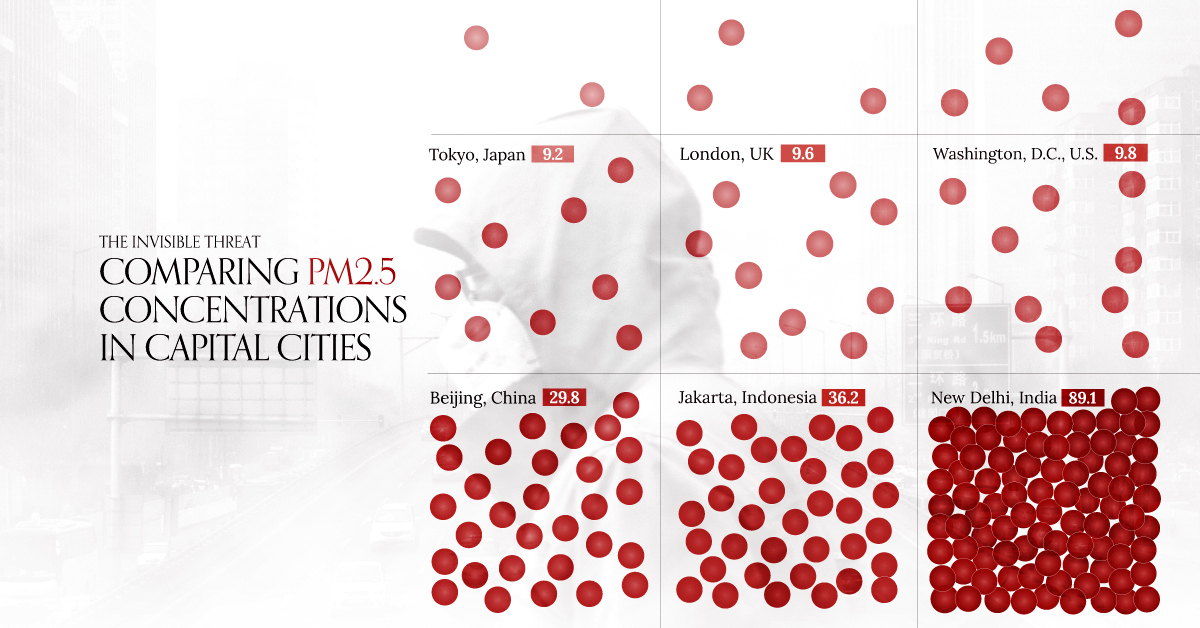
Comparing Air Quality and Pollution in 50 Capital Cities
We know bad air quality when we breathe it in—but how does it measure and compare across different cities?
To assess air quality, agencies measure the amount of particulate matter in an area to arrive at a number the resident population is breathing in over a period of time.
In this case, Planet Anomaly visualized the concentration of PM2.5 (fine particulate matter) in 50 select capital cities across the globe, using data from IQAir’s 2022 World Air Quality Report.
The report applied population-based adjustments to standardize its results and calculated an annual average of the data. If a city exceeded the WHO safety guideline of 5 micrograms per cubic meter (μg/m³) for annual average PM2.5 levels, it implied potential health risks for its residents.
Ranked: Capital Cities With the Best and Worst Air Quality
At the top of the list with the best air quality, Canberra, the capital of Australia, had an average PM2.5 level of 2.8 μg/m³ in 2022. Vehicle emissions and dust storms are the few sources of air pollutants in the city.
However, while Canberra did well in 2022, it had some of the worst air quality in 2020 when bushfire smoke blackened the skies.
Here’s the full list of all 116 capital cities measured by IQAir’s report, ranked by air quality from best to worst.
| Rank | City | Country | Region | 2022 Average PM2.5 Concentration |
|---|---|---|---|---|
| 1 | Canberra | 🇦🇺 Australia | Oceania | 2.8 |
| 2 | Hamilton | 🇧🇲 Bermuda | North America | 3.0 |
| 3 | Reykjavik | 🇮🇸 Iceland | Europe | 3.3 |
| 4 | San Juan | 🇵🇷 Puerto Rico | North America | 3.3 |
| 5 | Noumea | 🇳🇨 New Caledonia | Oceania | 3.5 |
| 6 | Saint George’s | 🇬🇩 Grenada | Central America | 3.8 |
| 7 | Tallinn | 🇪🇪 Estonia | Europe | 4.8 |
| 8 | Port of Spain | 🇹🇹 Trinidad & Tobago | Central America | 5.0 |
| 9 | Helsinki | 🇫🇮 Finland | Europe | 5.5 |
| 10 | Cape Town | 🇿🇦 South Africa | Africa | 6.7 |
| 11 | Ottawa | 🇨🇦 Canada | North America | 6.8 |
| 12 | Stockholm | 🇸🇪 Sweden | Europe | 6.8 |
| 13 | Oslo | 🇳🇴 Norway | Europe | 6.9 |
| 14 | Paramaribo | 🇸🇷 Suriname | South America | 7.0 |
| 15 | Dublin | 🇮🇪 Ireland | Europe | 7.1 |
| 16 | La Paz | 🇧🇴 Bolivia | South America | 7.3 |
| 17 | Lisbon | 🇵🇹 Portugal | Europe | 7.5 |
| 18 | San Jose | 🇨🇷 Costa Rica | Central America | 7.9 |
| 19 | Phnom Penh | 🇰🇭 Cambodia | Asia | 8.3 |
| 20 | Vaduz | 🇱🇮 Liechtenstein | Europe | 8.3 |
| 21 | Copenhagen | 🇩🇰 Denmark | Europe | 8.7 |
| 22 | Luanda | 🇦🇴 Angola | Africa | 8.8 |
| 23 | Managua | 🇳🇮 Nicaragua | Central America | 8.9 |
| 24 | Panama | 🇵🇦 Panama | Central America | 9.0 |
| 25 | Tokyo | 🇯🇵 Japan | Asia | 9.2 |
| 26 | Madrid | 🇪🇸 Spain | Europe | 9.5 |
| 27 | Kyiv | 🇺🇦 Ukraine | Europe | 9.5 |
| 28 | London | 🇬🇧 UK | Europe | 9.6 |
| 29 | Washington | 🇺🇸 U.S. | North America | 9.8 |
| 30 | Taipei | 🇹🇼 Taiwan | Asia | 9.9 |
| 31 | Amsterdam | 🇳🇱 Netherlands | Europe | 10.1 |
| 32 | Tegucigalpa | 🇭🇳 Honduras | Central America | 10.2 |
| 33 | Vienna | 🇦🇹 Austria | Europe | 10.5 |
| 34 | Bern | 🇨🇭 Switzerland | Europe | 10.5 |
| 35 | Brussels | 🇧🇪 Belgium | Europe | 10.6 |
| 36 | Moscow | 🇷🇺 Russia | Europe | 10.8 |
| 37 | Budapest | 🇭🇺 Hungary | Europe | 11.2 |
| 38 | Montevideo | 🇺🇾 Uruguay | South America | 11.3 |
| 39 | Nairobi | 🇰🇪 Kenya | Africa | 11.5 |
| 40 | Podgorica | 🇲🇪 Montenegro | Europe | 11.8 |
| 41 | Prague | 🇨🇿 Czech Republic | Europe | 11.9 |
| 42 | Berlin | 🇩🇪 Germany | Europe | 12.6 |
| 43 | Rome | 🇮🇹 Italy | Europe | 12.6 |
| 44 | Paris | 🇫🇷 France | Europe | 12.7 |
| 45 | Georgetown | 🇬🇾 Guyana | South America | 12.7 |
| 46 | Singapore | 🇸🇬 Singapore | Asia | 13.3 |
| 47 | San Salvador | 🇸🇻 El Salvador | Central America | 13.4 |
| 48 | Bratislava | 🇸🇰 Slovakia | Europe | 13.4 |
| 49 | Pristina | 🇽🇰 Kosovo | Europe | 13.7 |
| 50 | Ankara | 🇹🇷 Türkiye | Asia | 14.0 |
| 51 | Buenos Aires | 🇦🇷 Argentina | South America | 14.2 |
| 52 | Hong Kong | 🇭🇰 Hong Kong SAR | Asia | 14.4 |
| 53 | Tirana | 🇦🇱 Albania | Europe | 14.5 |
| 54 | Vilnius | 🇱🇹 Lithuania | Europe | 14.5 |
| 55 | Metro Manila | 🇵🇭 Philippines | Asia | 14.6 |
| 56 | Bogota | 🇨🇴 Colombia | South America | 15.1 |
| 57 | Warsaw | 🇵🇱 Poland | Europe | 15.3 |
| 58 | Kinshasa | 🇨🇩 DRC | Africa | 15.5 |
| 59 | Ljubljana | 🇸🇮 Slovenia | Europe | 16.2 |
| 60 | Tbilisi | 🇬🇪 Georgia | Europe | 16.3 |
| 61 | Nicosia | 🇨🇾 Cyprus | Europe | 16.4 |
| 62 | Bucharest | 🇷🇴 Romania | Europe | 17.1 |
| 63 | Kuala Lumpur | 🇲🇾 Malaysia | Asia | 17.6 |
| 64 | Algiers | 🇩🇿 Algeria | Africa | 17.8 |
| 65 | Bangkok | 🇹🇭 Thailand | Asia | 18.0 |
| 66 | Seoul | 🇰🇷 South Korea | Asia | 18.3 |
| 67 | Guatemala City | 🇬🇹 Guatemala | Central America | 18.5 |
| 68 | Baku | 🇦🇿 Azerbaijan | Asia | 18.9 |
| 69 | Sofia | 🇧🇬 Bulgaria | Europe | 19.1 |
| 70 | Athens | 🇬🇷 Greece | Europe | 19.2 |
| 71 | Tel Aviv-Yafo | 🇮🇱 Israel | Middle East | 19.5 |
| 72 | Dakar | 🇸🇳 Senegal | Africa | 20.4 |
| 73 | Colombo | 🇱🇰 Sri Lanka | Asia | 20.9 |
| 74 | Astana | 🇰🇿 Kazakhstan | Asia | 21.4 |
| 75 | Ashgabat | 🇹🇲 Turkmenistan | Asia | 21.6 |
| 76 | Mexico City | 🇲🇽 Mexico | North America | 22.1 |
| 77 | Belgrade | 🇷🇸 Serbia | Europe | 22.1 |
| 78 | Zagreb | 🇭🇷 Croatia | Europe | 22.4 |
| 79 | Abidjan | 🇨🇮 Ivory Coast | Africa | 22.5 |
| 80 | Chisinau | 🇲🇩 Moldova | Europe | 22.6 |
| 81 | Antananarivo | 🇲🇬 Madagascar | Africa | 23.7 |
| 82 | Yangon | 🇲🇲 Myanmar | Asia | 24.3 |
| 83 | Lusaka | 🇿🇲 Zambia | Africa | 24.6 |
| 84 | Lima | 🇵🇪 Peru | South America | 25.6 |
| 85 | Santiago | 🇨🇱 Chile | South America | 25.8 |
| 86 | Skopje | 🇲🇰 North Macedonia | Europe | 26.6 |
| 87 | Vientiane | 🇱🇦 Laos | Asia | 27.6 |
| 88 | Bishkek | 🇰🇬 Kyrgyzstan | Asia | 29.0 |
| 89 | Beijing | 🇨🇳 China | Asia | 29.8 |
| 90 | Accra | 🇬🇭 Ghana | Africa | 30.1 |
| 91 | Ulaanbaatar | 🇲🇳 Mongolia | Asia | 30.6 |
| 92 | Addis Ababa | 🇪🇹 Ethiopia | Africa | 31.3 |
| 93 | Yerevan | 🇦🇲 Armenia | Asia | 31.4 |
| 94 | Sarajevo | 🇧🇦 Bosnia Herzegovina | Europe | 32.4 |
| 95 | Tashkent | 🇺🇿 Uzbekistan | Asia | 33.5 |
| 96 | Tehran | 🇮🇷 Iran | Asia | 36.1 |
| 97 | Jakarta | 🇮🇩 Indonesia | Asia | 36.2 |
| 98 | Kampala | 🇺🇬 Uganda | Africa | 39.6 |
| 99 | Hanoi | 🇻🇳 Vietnam | Asia | 40.1 |
| 100 | Islamabad | 🇵🇰 Pakistan | Asia | 40.6 |
| 101 | Kathmandu | 🇳🇵 Nepal | Asia | 40.7 |
| 102 | Doha | 🇶🇦 Qatar | Middle East | 41.8 |
| 103 | Kigali | 🇷🇼 Rwanda | Africa | 44.0 |
| 104 | Khartoum | 🇸🇩 Sudan | Africa | 44.6 |
| 105 | Riyadh | 🇸🇦 Saudi Arabia | Middle East | 46.2 |
| 106 | Abuja | 🇳🇬 Nigeria | Africa | 46.5 |
| 107 | Cairo | 🇪🇬 Egypt | Africa | 47.4 |
| 108 | Dushanbe | 🇹🇯 Tajikistan | Asia | 47.7 |
| 109 | Abu Dhabi | 🇦🇪 UAE | Middle East | 48.0 |
| 110 | Kuwait City | 🇰🇼 Kuwait | Middle East | 57.5 |
| 111 | Ougadougou | 🇧🇫 Burkina Faso | Africa | 63.0 |
| 112 | Dhaka | 🇧🇩 Bangladesh | Asia | 65.8 |
| 113 | Manama | 🇧🇭 Bahrain | Middle East | 66.6 |
| 114 | Baghdad | 🇮🇶 Iraq | Asia | 86.7 |
| 115 | New Delhi | 🇮🇳 India | Asia | 89.1 |
| 116 | N’Djamena | 🇹🇩 Chad | Africa | 89.7 |
Hamilton, Bermuda (3.8 μg/m³) and Reykjavik, Iceland (3.3 μg/m³) rank second and third respectively, followed by three more capitals on island nations. In fact, nine of the top 10 capitals are situated directly on a coastline and take advantage of ocean breezes that can act as air filters.
Ranked 8th, the Port of Spain (capital of Trinidad & Tobago) is the last city whose air quality is considered safe (5.0 μg/m³) by the WHO.
From a broader perspective, fewer than 10% of all countries have air quality that meets safety guidelines.
Meanwhile, at the bottom of the list with the worst air quality, Chad’s capital city N’Djamena, recorded a PM2.5 concentration of nearly 90 μg/m³ per day in 2022—almost 18x the recommended WHO safety guideline.
Air Quality Correlates With Countries’ Income Levels
Perhaps the most striking feature of the rankings is how air quality worsens with countries that are in the low and middle-income categories and improves in high income countries.
As an example, compare the distribution of the ranks of capital cities in Asia (generally lower and middle income countries) versus capitals in Europe (general high income countries).
| Air Quality Ranks | Cities in Asia | Cities in Europe |
|---|---|---|
| Top 20 | 3.33% | 20.51% |
| 20–40 | 6.67% | 28.21% |
| 40–60 | 13.33% | 28.21% |
| 60–80 | 23.33% | 17.95% |
| 80–100 | 36.67% | 5.13% |
| 100–116 | 16.67% | 0.00% |
The majority of European capital cities are ranked 20–60 versus Asian capitals which are mostly ranked 60–100.
Lower and middle income countries have larger structural economic concerns and many of them are still in the process of transitioning away from polluting materials that affect air quality.
-

 Brands3 weeks ago
Ranked: The 20 Best Franchises to Open in the U.S.
-

 Economy1 week ago
Visualizing the Most Sought-After Entry Level Jobs in 2023
-

 Markets3 weeks ago
Ranked: The Highest Paid CEOs in the S&P 500
-

 Automotive1 week ago
Ranked: The World’s Top 10 Automotive Exporters (2000-2022)
-

 Markets3 weeks ago
Charted: Market Volatility at its Lowest Point Since 2020
-

 Green1 week ago
Ranked: The Most Carbon-Intensive Sectors in the World
-
 Wealth3 weeks ago
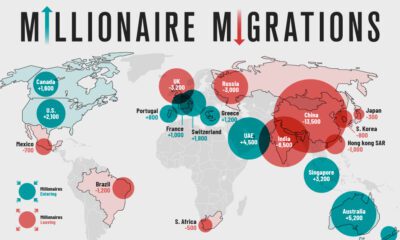
Mapped: The Migration of the World’s Millionaires in 2023
-

 Personal Finance1 week ago
Charted: Retirement Age by Country