Markets
Charted: The Rise and Fall of WeWork
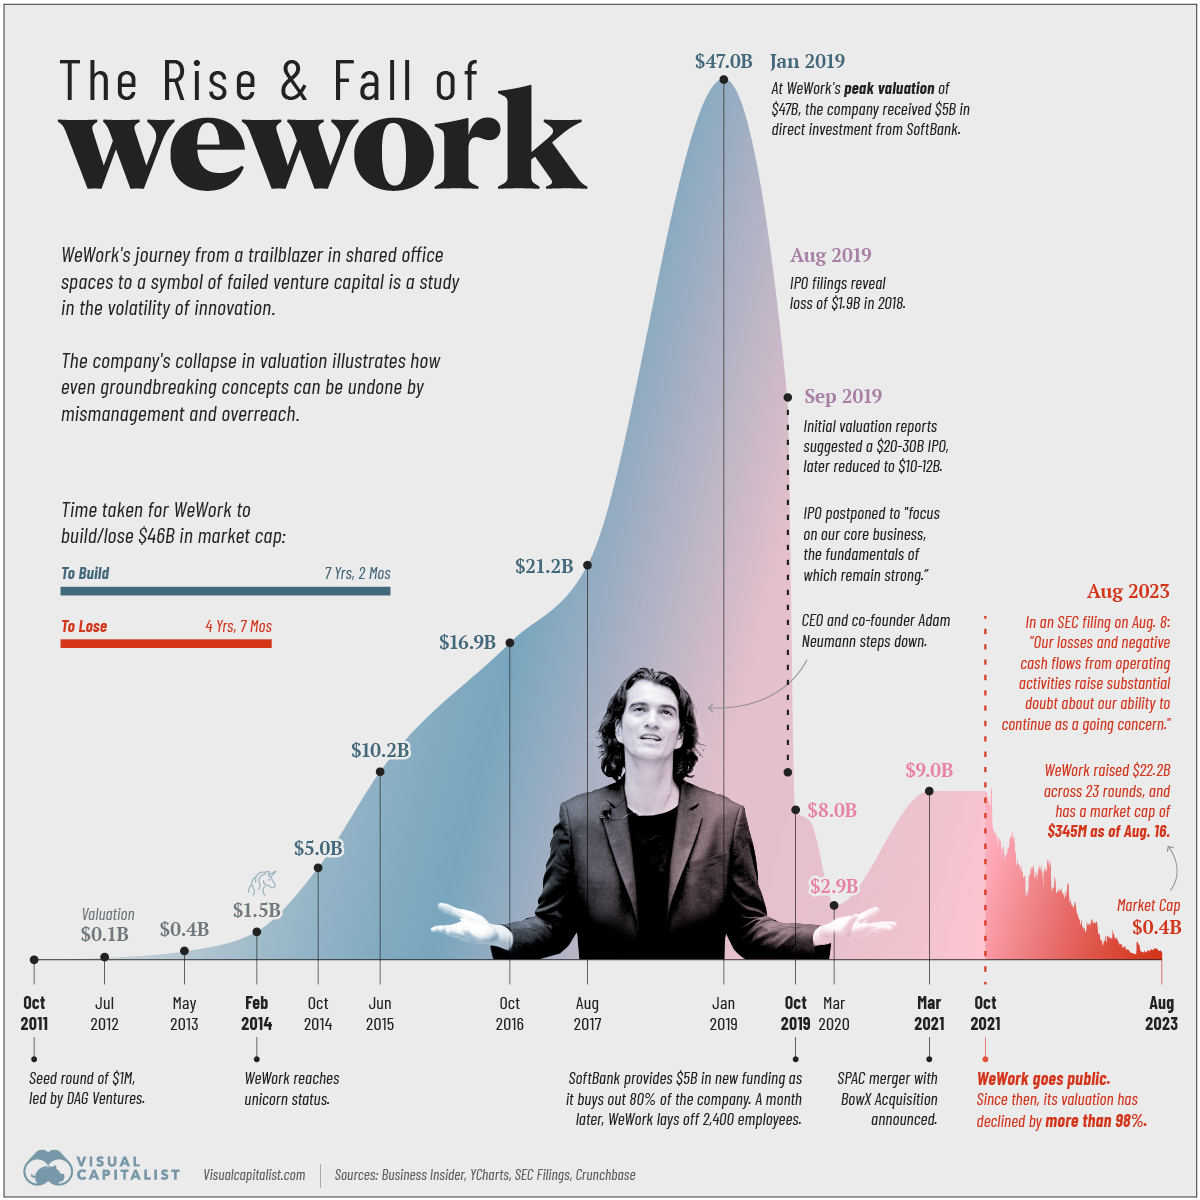


Charted: The Rise and Fall of WeWork
Despite its recommitment to core business fundamentals in the last few years, WeWork’s management—which saw a shakeup in May 2023 when CEO Sandeep Mathrani departed—is setting off a signal flare about the company’s future.
“Our losses and negative cash flows from operating activities raise substantial doubt about our ability to continue as a going concern.” — WeWork, SEC filing, August 8th, 2023.
But how did the once-poster child of Silicon Valley end up seeing its valuation collapse more than 99% from its peak?
Pulling together data from Business Insider, YCharts, SEC Filings, and Crunchbase we follow the rise and fall of WeWork since 2011.
The Rise of WeWork: 2010–2019
WeWork was founded in 2010 by Adam Neumann and Miguel McKelvey with the primary objective of providing shared workspaces catered to freelancers, startups, and companies seeking “flexible office solutions.”
The business model, which rested on renting space from developers long-term, renovating and parceling the property, and subsequently leasing it out to short-term clients, thrived in a decade of low interest rates.
Its valuation surpassed $1 billion in 2014, earning the coveted “unicorn” status. In 2017, SoftBank Group made the first of its total $18.5 billion investment in the company. Two years later, WeWork hit a peak valuation of $47 billion with SoftBank’s continued investments, raising expectations for an imminent IPO.
| Date | WeWork's Valuation |
|---|---|
| October, 2011 | n/a |
| July, 2012 | $97 million |
| May, 2013 | $440 million |
| February, 2014 | $1.5 billion |
| October, 2014 | $5.0 billion |
| June, 2015 | $10.2 billion |
| October, 2016 | $16.9 billion |
| August, 2017 | $21.2 billion |
| January, 2019 | $47.0 billion |
| August, 2019 | $20-30 billion |
| September, 2019 | $10-12 billion |
| October, 2019 | $8.0 billion |
| December, 2019 | $7.3 billion* |
| March, 2020 | $2.9 billion* |
| March, 2021 | $9.0 billion |
| October, 2021 | $9.0 billion |
| August, 2023 | $0.4 billion |
Footnote: *SoftBank valuation is based on discounted cash flow method.
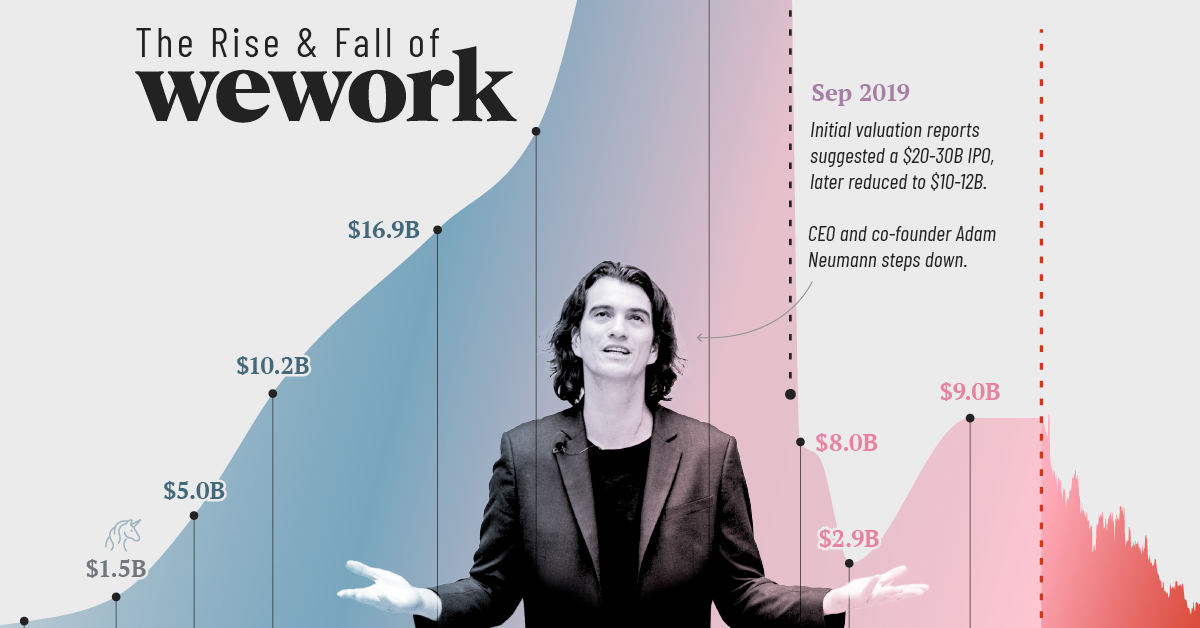
The Fall of WeWork: 2019–2023
Intensive scrutiny fueled by the impending IPO raised several questions for the company. These included concerns around Neumann’s leadership style, excessive spending, creative accounting, and conflicts of interest leading to Neumann’s resignation and delay of the IPO.
In October 2019, SoftBank Group acquired 80% of the company with $5 billion of additional funding. A month later WeWork laid off 2,400 employees, nearly one-fifth of its workforce.
Real estate veteran Sandeep Mathrani was made CEO in 2020, tasked with turning the company around by eliminating recurring costs and restructuring its debt.
That same year the COVID-19 pandemic forced a significant shift to remote work, causing a decline in office space demand. WeWork’s business model, focused on shared physical spaces, faced a substantial challenge.
In 2021, WeWork went public through a SPAC merger, aiming to regain investor trust. The listing reflected a revised strategy focusing on key markets, cost optimization, and a pivot toward catering to larger corporate clients with hybrid work needs.
Over the past two years, its market capitalization as a publicly-traded company has plummeted from $9 billion to under half a billion dollars. WeWork disclosed $11.4 billion in net losses from 2020 through to June 30th, 2023 in their recent SEC filing.
What Happened to WeWork?
Aside from the trials and tribulations of former CEO Adam Neumann, the company’s sustainability itself has been questioned several times over the past decade. In 2019, the Guardian summarized the criticism succinctly by saying, the company was “renting long and subleasing short,” which left it “exposed to risk.”
Post-pandemic, the proliferation of work-from-home policies, along with the rapid rise in global interest rates in the last year—which can reduce cash flows for the commercial real estate industry—have magnified those risks.
WeWork is now battling an environment of excess supply, softer demand, increased competition and macroeconomic volatility, according to interim CEO David Tolley.
“It was foolish of me to invest in WeWork. I was wrong.” — Masayoshi Son, SoftBank Group founder.
The New York Times says that WeWork has more than 18 million square feet of rentable office space in the U.S. and Canada alone and that its failure could have a “sizable impact” on the commercial real estate industry.
At the same time, the Times notes that reporting the “substantial doubt” on continued business operations might help the company buy time with lenders to seek additional capital through issuance of debt, equity, or the sale of assets.


Economy
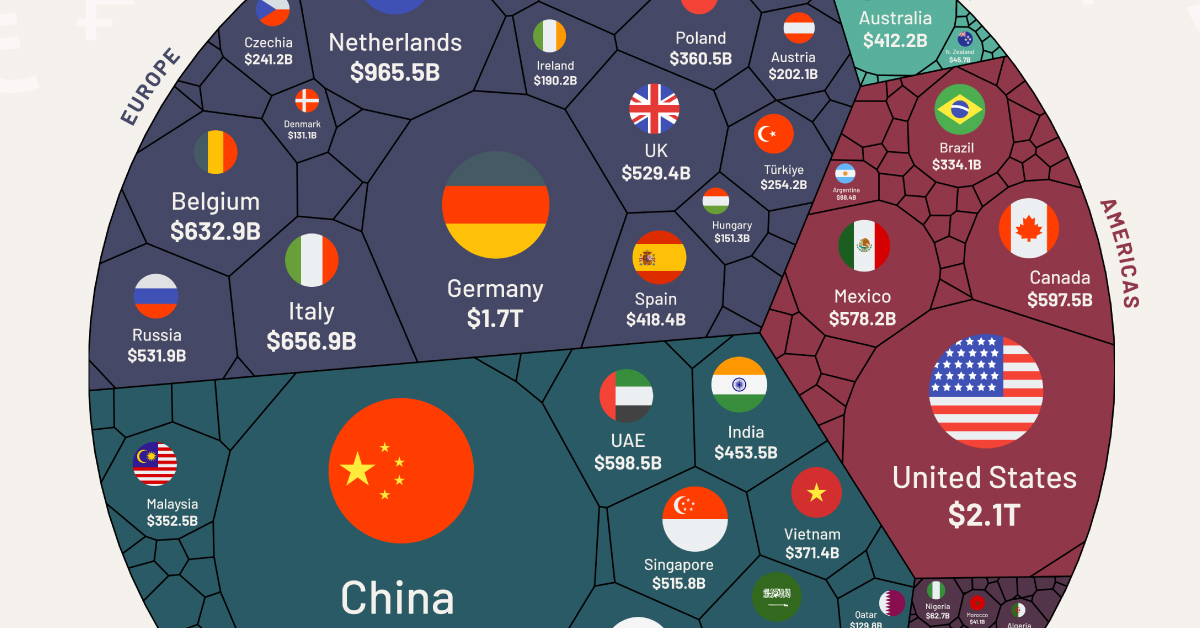
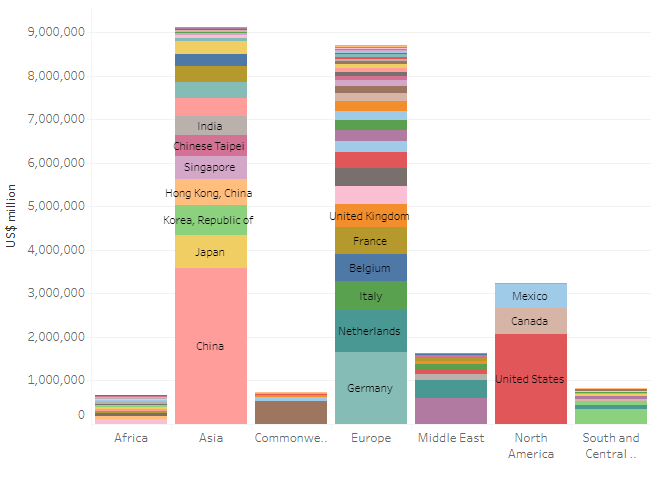
All of the World’s Exports by Country, in One Chart
We visualize nearly $25 trillion of global exports by country, showing you the top exporting nations and the data behind it all.
 Creator Program
All of the World’s Exports by Country, in One Chart
In 2022, the total export value of global goods reached nearly $25 trillion.
With the evolution of international trade, the effects of globalization, and progress in technology, global trade has increased by around 300% over the last 20 years.
This visualization by Truman Du uses data from the World Trade Organization (WTO) to chart the world’s top exporters by country.
China is Still the “World’s Factory”
The world’s largest 11 exporters shipped out $12.8 trillion of goods in 2022, more than the rest of the world combined ($12.1 trillion).
The list is headed by China, with $3.6 trillion or 14% of total exports. The country has been the largest exporter of goods in the world since 2009.
| Top 11 | Country | Exports (USD) |
|---|---|---|
| 1 | 🇨🇳 China | $3.6T |
| 2 | 🇺🇸 U.S. | $2.1T |
| 3 | 🇩🇪 Germany | $1.7T |
| 4 | 🇳🇱 Netherlands | $965.5B |
| 5 | 🇯🇵 Japan | $746.9B |
| 6 | 🇰🇷 South Korea | $683.6B |
| 7 | 🇮🇹 Italy | $656.9B |
| 8 | 🇧🇪 Belgium | $632.9B |
| 9 | 🇫🇷 France | $617.8B |
| 10 | 🇭🇰 Hong Kong | $609.9B |
| 11 | 🇦🇪 United Arab Emirates | $598.5B |
In 2022, the top products exported from China by value were phones (including smartphones), computers, optical readers, integrated circuits, solar power diodes, and semiconductors.
Two of China’s primary trading partners are neighboring countries Japan and South Korea.
Mexico Surpasses China as America’s Largest Trading Partner
China has built up significant trade relations with the European Union and the United States, two of the world’s largest markets for goods.
However, recent trade tensions have led to China losing its status as the United States’ biggest trading partner in 2023.
Mexico has now overtaken China as the largest seller to the United States. This shift in trade dynamics is part of a broader effort by the U.S. to import goods from closer to home and reduce its dependence on geopolitical rivals.
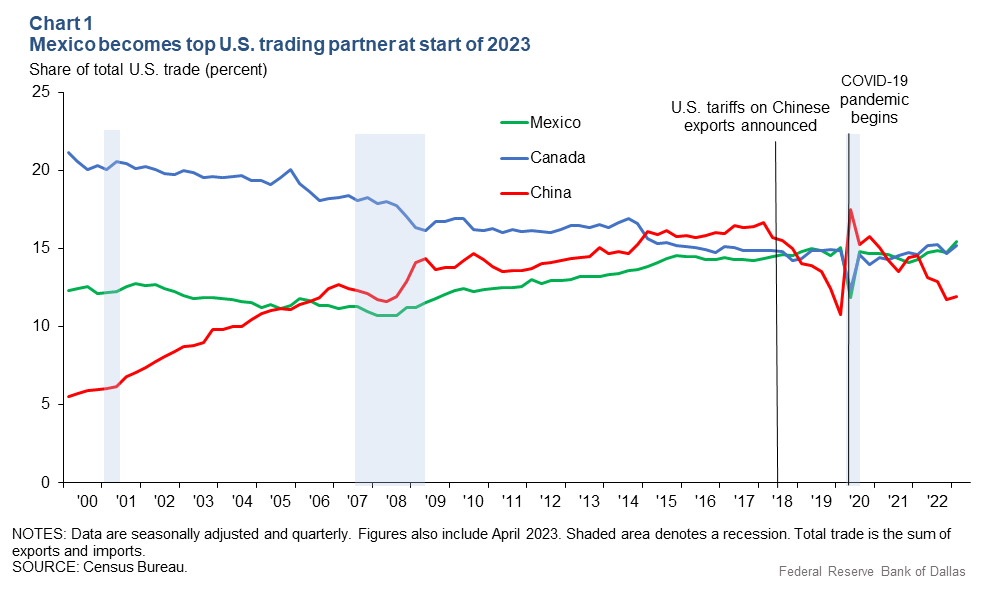
The U.S. itself is the world’s second largest goods exporter, with over $2 trillion annually.
Canada was the largest purchaser of U.S. exports in 2022, accounting for 17% of total exports, followed by Mexico, China, Japan, and the United Kingdom.
The top exports of the United States are refined petroleum, petroleum gas, crude petroleum, cars, and integrated circuits.
The Regional View of Exports by Country
From a regional perspective, it’s clear Asia dominates the trading market with over 36% of the total exports, followed by Europe with 34%.
Source: World Trade Organization
While Asian, European, and North American countries have manufactured and technology products among their main exports, African and South American countries mostly export commodities such as oil, gold, diamonds, cocoa, timber, and precious metals.
A New Era of Deglobalization?
International trade grew immensely at the beginning of the 21st century, from $15.6 trillion in 2001 to $40.7 trillion in 2008.
Since then, protectionist trade policies such as taxes on foreign goods and import quotas have increased by 663%. Similarly, global trade as a percent of GDP has also stalled out, peaking in 2008 and going sideways ever since.
Despite many countries reducing their interdependence and integration in the post-COVID era, global exports are still set to grow by 70% between 2020 and 2030, reaching $29.7 trillion by 2030, according to Standard Chartered.
-

 Misc4 days ago
Ranked: The World’s Top 10 Automotive Exporters (2000-2022)
-
 Business4 weeks ago
Visualizing the Number of Costco Stores, by Country
-
 Markets2 weeks ago
Charted: Market Volatility at its Lowest Point Since 2020
-

 Green3 days ago
Ranked: The Most Carbon-Intensive Sectors in the World
-

 Culture4 weeks ago
Ranked: Which Countries Drink the Most Beer?
-
 Wealth2 weeks ago
Mapped: The Migration of the World’s Millionaires in 2023
-

 Demographics3 days ago
Charted: Retirement Age by Country
-

 Maps4 weeks ago
Mapped: The Deadliest Earthquakes of the 21st Century