Maps
Interactive Map: U.S. Property Taxes by State
Article/Editing:
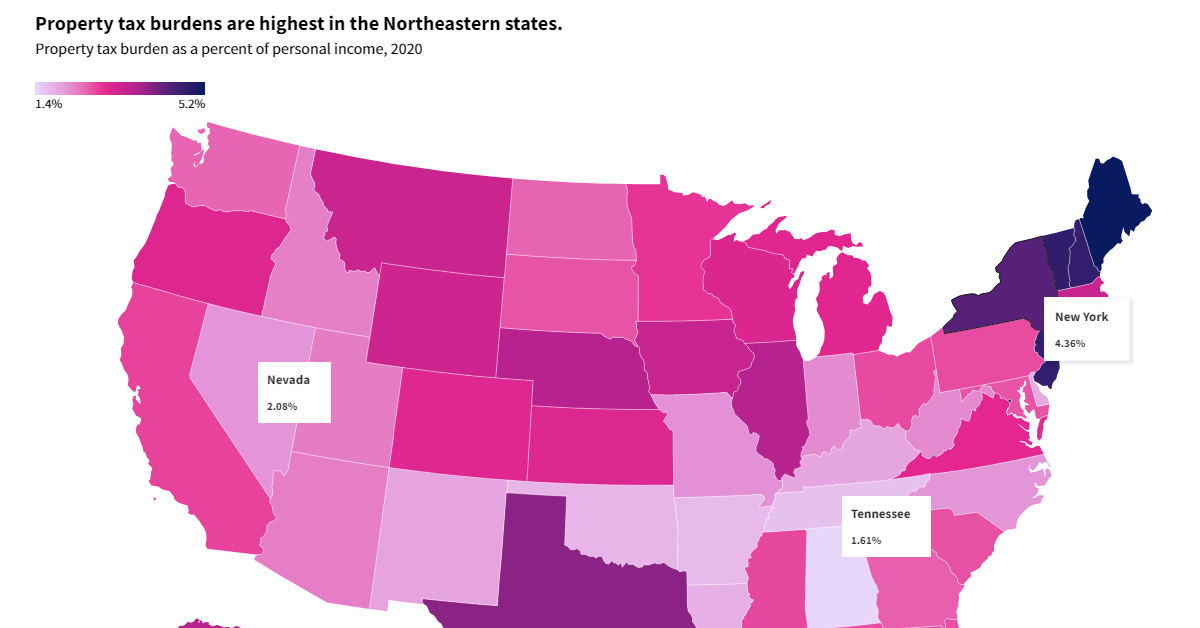
Mapped: U.S. Property Taxes by State
Almost $600 billion in revenue was generated from U.S. state and local property tax revenue in 2020, a figure that has gradually risen over the last several decades.
Yet these taxes, and how much people feel their effects, vary meaningfully across states based on factors like median incomes, effective property tax rates, and home values.
The above interactive graphic from USAFacts shows the states with the highest and lowest property tax burdens as a percentage of personal income in 2020.
Which U.S. States Have the Highest Property Tax Burdens?
Overall, Maine collects the most burdensome property taxes, at 5.21% of personal income. That means that, for every $100,000 in annual salary earned by a Maine resident, $5,210 would go towards property taxes on average.
Below, we show how much people pay in property tax as a portion of their personal income, based on data from the Census Bureau and the Bureau of Economic Analysis as of 2020:
| Rank | State | Property Tax (% Personal Income) |
|---|---|---|
| 1 | Maine | 5.21% |
| 2 | Vermont | 4.82% |
| 3 | New Jersey | 4.80% |
| 4 | New Hampshire | 4.79% |
| 5 | District of Columbia | 4.73% |
| 6 | New York | 4.36% |
| 7 | Connecticut | 4.20% |
| 8 | Rhode Island | 4.09% |
| 9 | Texas | 3.99% |
| 10 | Illinois | 3.65% |
| 11 | Nebraska | 3.64% |
| 12 | Alaska | 3.63% |
| 13 | Iowa | 3.39% |
| 14 | Massachusetts | 3.37% |
| 15 | Montana | 3.34% |
| 16 | Wyoming | 3.29% |
| 17 | Wisconsin | 3.07% |
| 18 | Kansas | 3.06% |
| 19 | Oregon | 3.04% |
| 20 (tie) | Colorado | 2.99% |
| 20 (tie) | Michigan | 2.99% |
| 22 | Virginia | 2.94% |
| 23 | Minnesota | 2.85% |
| 24 | California | 2.77% |
| 25 | Mississippi | 2.73% |
| 26 (tie) | Ohio | 2.72% |
| 26 (tie) | Hawaii | 2.72% |
| 28 | Pennsylvania | 2.71% |
| 29 | Florida | 2.69% |
| 30 | South Carolina | 2.68% |
| 31 (tie) | South Dakota | 2.66% |
| 31 (tie) | Maryland | 2.66% |
| 33 | Georgia | 2.57% |
| 34 (tie) | North Dakota | 2.53% |
| 34 (tie) | Washington | 2.53% |
| 36 | Utah | 2.32% |
| 37 | Arizona | 2.31% |
| 38 | Idaho | 2.28% |
| 39 | West Virginia | 2.22% |
| 40 | Indiana | 2.19% |
| 41 | Missouri | 2.14% |
| 42 (tie) | North Carolina | 2.08% |
| 42 (tie) | Nevada | 2.08% |
| 44 | New Mexico | 1.92% |
| 45 | Kentucky | 1.91% |
| 46 | Delaware | 1.86% |
| 47 | Louisiana | 1.80% |
| 48 | Oklahoma | 1.75% |
| 49 | Arkansas | 1.69% |
| 50 | Tennessee | 1.61% |
| 51 | Alabama | 1.37% |
At third, people living in New Jersey pay 4.8% of their income on property tax. The state not only has high property tax rates but some of the most expensive housing in the country, causing property taxes to feel elevated.
Falling in the middle of the pack is Hawaii, with 2.7% of personal income paid to property taxes. While the state has the lowest effective property tax rate at 0.3%, soaring home prices have led the actual tax costs to increase.
The lowest tax costs were seen in Alabama, making up 1.4% of a person’s income.
The Highest Property Taxes per Person
Breaking down the property tax revenues of different states by person, instead of by income, reveals a slightly different ranking:
On a per-capita basis, many populous Northeastern states rank higher. At the top, New Jersey had the highest per capita property tax revenues at $3,580 in 2020, followed by New Hampshire and Connecticut at $3,300.
Once again falling at the end of the pack are Southern states with smaller populations. Alabama saw $647 paid per person in property taxes—or less than a fifth of New Jersey’s tax costs.
Role in Education Funding
Today, the vast majority of public education funding comes from local property tax revenue.
It’s no surprise that higher local tax revenues have been tied with improved levels of public education including better access to advanced curriculum, higher quality buildings, stronger student achievement, and a decrease in disciplinary problems.
Meanwhile, residents in lower-income neighborhoods have been shown to pay higher effective property tax rates than residents in affluent ones. For instance, Silicon Valley's Palo Alto had the lowest effective property tax rate in California in 2015 thanks to soaring property values, since houses in California are taxed on assessed values from when homes are sold.
Overall, we can see that wide disparities in property taxes exist by each state. This is seen not only in their percent of personal income, but on total tax collected, and local tax rates.

This article was published as a part of Visual Capitalist's Creator Program, which features data-driven visuals from some of our favorite Creators around the world.


Maps
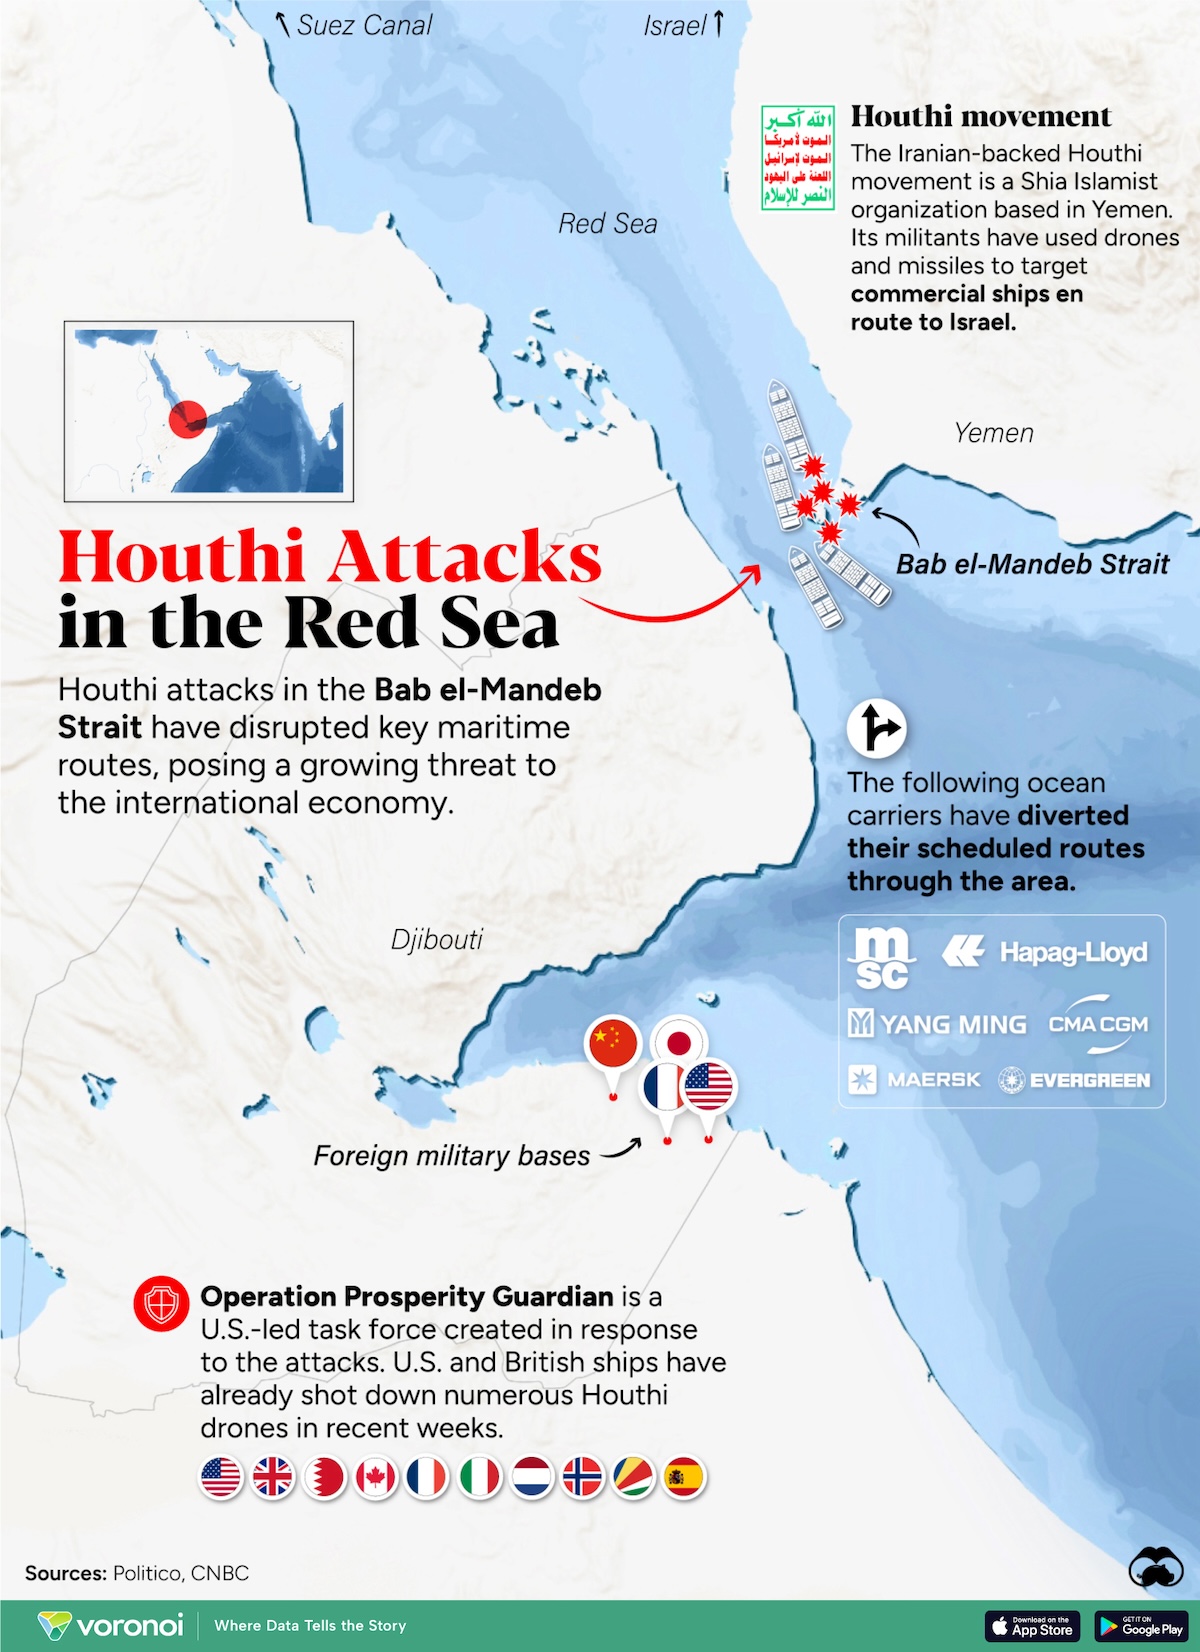
Mapped: How Houthi Attacks in the Red Sea Impact the Global Economy
The Iranian-backed group is using drones to attack vessels that they believe are delivering goods to Israel, forcing shipping companies cancel routes passing through the Red Sea.

How Houthi Attacks in the Red Sea Impact the Global Economy
Since October 7th, Houthi militants in Yemen have been targeting commercial cargo ships in the Red Sea, severely disrupting maritime trade.
The Iranian-backed group is using drones to attack vessels that they believe are delivering goods to Israel, forcing ocean carriers like MSC and Hapag-Lloyd to to cancel and detour routes originally meant to pass through the Red Sea.
These strikes are occurring in the crucial Bab al-Mandab Strait, which connects the Red Sea to the Arabian sea, and is bordered by the Yemen on one side and Djibouti and Eritrea on the other.
The Houthis, a Shiite minority sect in Yemen, wrested control of large portions of the country, including the capital Sanaa and a key Red Sea port, Al-Hudaydah, from the Saudi Arabian-backed Sunni government in 2014.
Their latest attacks are pushing shipping companies to avoid the Red Sea, in turn preventing access to the Suez Canal, through which nearly 12% of global maritime trade passes through.
What do Houthi Attacks in the Red Sea Mean for the International Economy?
The world economy has already had a difficult two years, with inflation sparking a cost of living crisis across many countries.
Now, ships diverted from the Suez Canal will be forced to go around the Cape of Good Hope, much like trade did before the Suez Canal existed.
This longer journey increases fuel costs, reduces shipping efficiencies, and could raise the prices of imported goods, which includes critical shipments of grain from Asia and oil from the Middle East.
The price of Brent Crude has already climbed 8% in the last week.
| Rank | Shipping Lane | Ships/Day | Connects |
|---|---|---|---|
| 1 | English Channel | 400 | UK/Europe |
| 2 | Malacca Strait | 230 | Asia/Middle East/Europe |
| 3 | Strait of Hormuz | 55 | Iran/Oman/UAE |
| 4 | Suez Canal | 50 | Asia/Middle East/Europe |
| 5 | Panama Canal | 38 | East/West Coast Americas/Asia |
Source: TEC Container Solutions.
Meanwhile, operators of the Panama Canal, another key shipping lane, have had to reduce traffic through the passageway due to a prolonged drought in the country, also disrupting global shipping.
In response to the Houthi attacks, the U.S. has recently announced a defense coalition leading nine other nations that will work together to strengthen security in the area.

-

 Money7 days ago
Charted: Car Ownership Costs in America Skyrocket (2020–2023)
-

 Markets2 weeks ago
The Investment Playbook for 2024: Visualized
-
 Markets2 weeks ago
Mapped: The Top Global Financial Centers in 2023
-

 Gen Z2 weeks ago
Ranked: Gen Z’s Favorite Brands in 2023
-

 Green2 weeks ago
Charted: Global CO2 Emissions by Income Group
-
 Markets2 weeks ago
Ranked: Share of Million-Dollar Homes in U.S. Cities
-

 Money1 week ago
Ranked: Cities With the Most Millionaires in the World
-
 Globalization1 week ago
Charted: India’s FDI Inflows Over the Last 20+ Years