Markets
Visualizing the World’s Largest Sovereign Wealth Fund
![]() See this visualization first on the Voronoi app.
See this visualization first on the Voronoi app.
 />
/>The World’s Largest Sovereign Wealth Fund
This was originally posted on our Voronoi app. Download the app for free on iOS or Android and discover incredible data-driven charts from a variety of trusted sources.
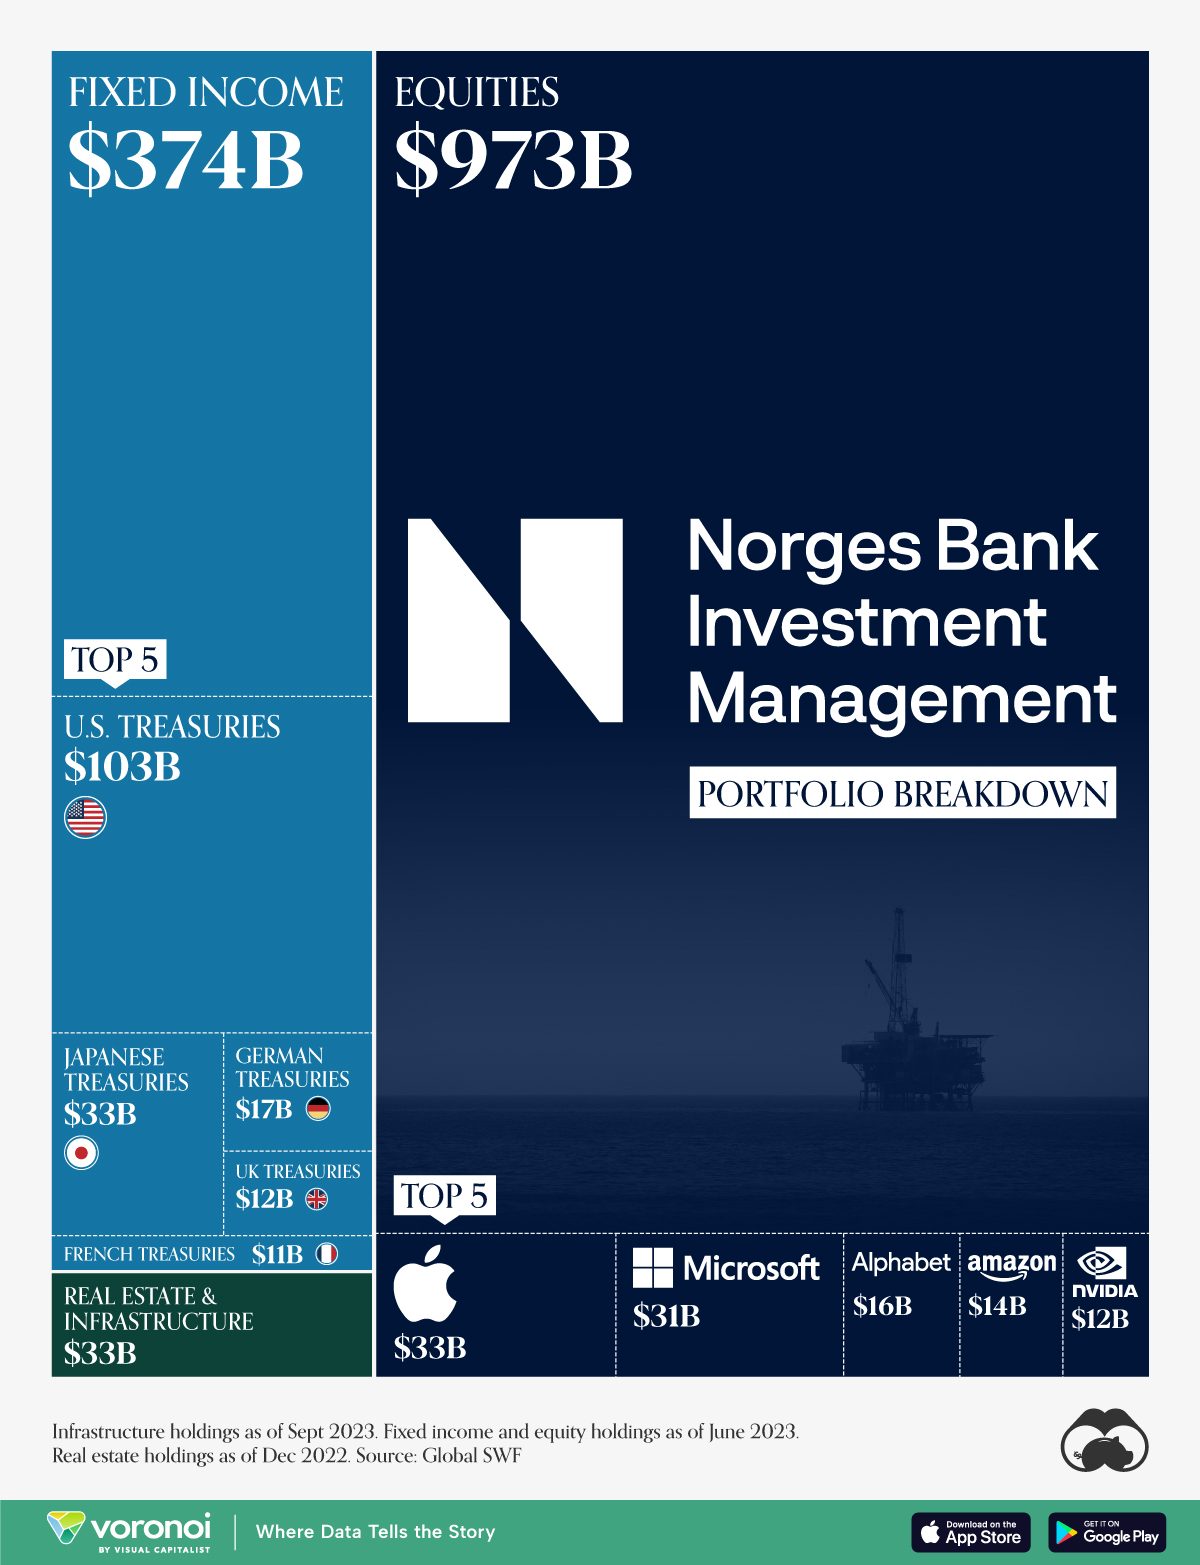
Norway is home to the biggest sovereign wealth fund globally, valued at nearly $1.4 trillion.
In 2023, the fund posted record profits, bolstered by tech holdings that include Microsoft, Apple, and Nvidia. Originating in 1996, the fund was created to invest surplus earnings from its massive energy sector—where it ranks as the fourth-largest exporter of natural gas in the world.
This graphic breaks down the portfolio of Norway’s sovereign wealth fund, based on data from Global SWF.
Portfolio Breakdown of Norway’s Sovereign Wealth Fund
Here’s how the fund, Norges Bank Investment Management, invests its portfolio according to asset type:
| Asset Class | Value | Percentage of Portfolio |
|---|---|---|
| Fixed Income | $374B | 27.1% |
| Equities | $973B | 70.5% |
| Real Estate | $30B | 2.2% |
| Infrastructure | $3B | 0.2% |
Infrastructure holdings as of Sept 2023. Fixed income and equity holdings as of June 2023. Real estate holdings as of Dec 2022.
As we can see, the majority of the fund is invested in equities, with a 70.5% share of the portfolio.
Overall, the fund invests in 9,000 companies worldwide, with the highest exposure across North American firms. As the table below shows, the top five holdings in the portfolio are heavily concentrated in the tech sector:
| Equities | Value |
|---|---|
| Apple | $33B |
| Microsoft | $31B |
| Alphabet | $16B |
| Amazon | $14B |
| Nvidia | $12B |
Apple is the portfolio’s largest equity holding, worth $33 billion. Last year, the tech giant witnessed 45% returns.
The next largest asset type is fixed income, which makes up 27.1% of the portfolio. The greatest share is held in government bonds, but the fund also invests a portion in debt issued from the corporate sector. Here are the top fixed income holdings across the portfolio:
| Fixed Income | Value |
|---|---|
| U.S. Treasuries | $103B |
| Japanese Treasuries | $33B |
| German Treasuries | $17B |
| UK Treasuries | $12B |
| French Treasuries | $11B |
In addition to equities and fixed income, the fund invests in real estate and infrastructure.
This covers 890 investments globally which are found mainly in office and retail sectors. In fact, between 2012 and 2022, these investments have grown over eightfold to $33 billion—which include a 25% ownership in London’s Regent Street, one of the city’s busiest shopping districts with over 7.5 million visitors annually.


Markets
The 12 Worst Investment Funds Over the Past Decade
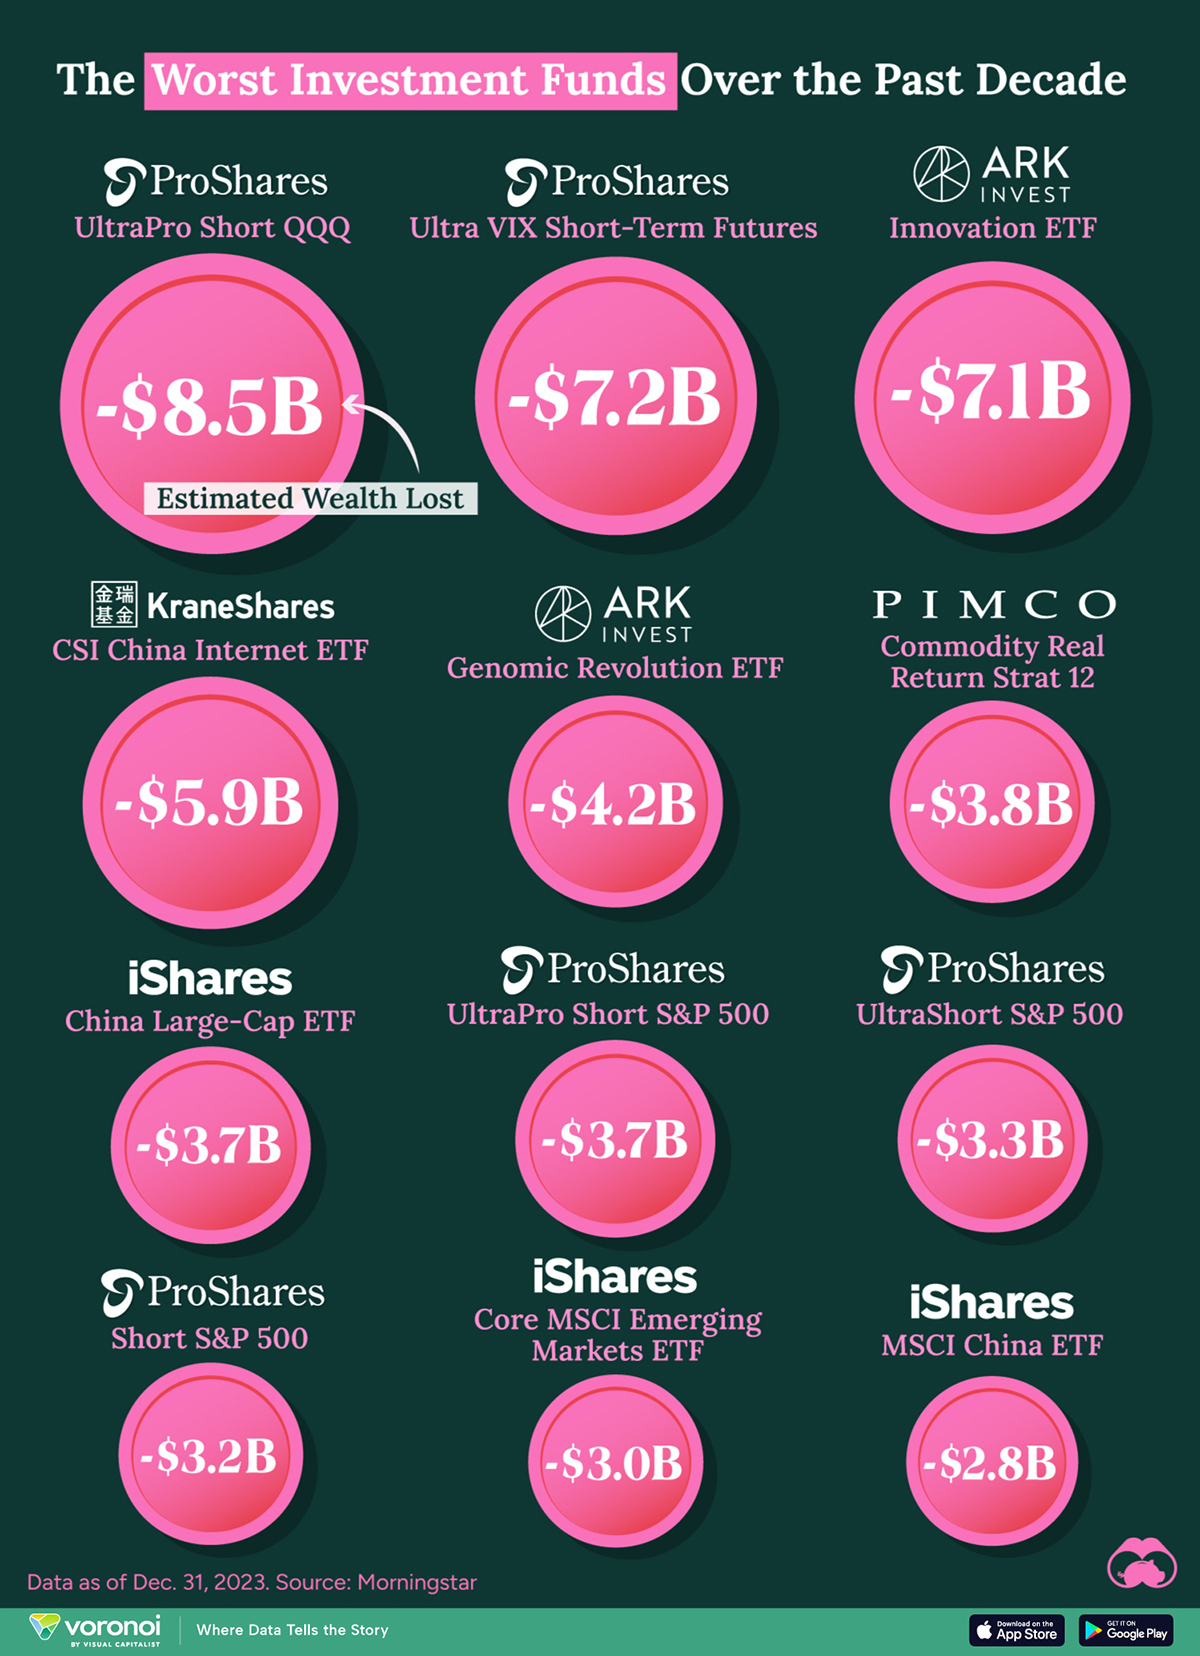
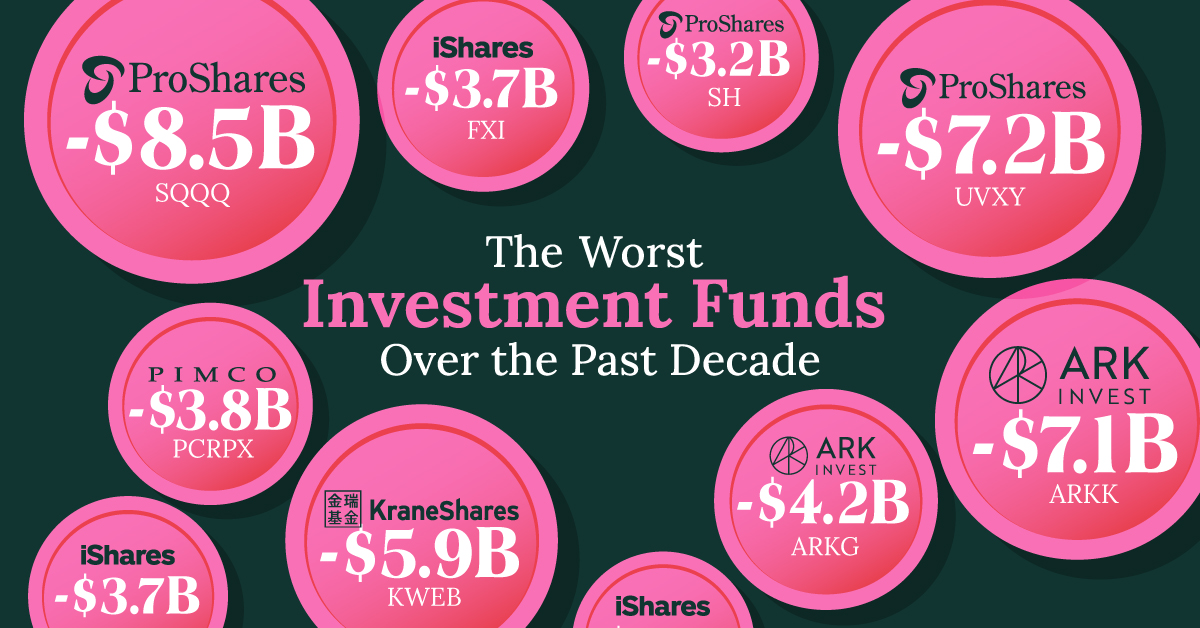
The 12 worst investment funds have destroyed $56 billion in shareholder wealth over the past decade, as of Dec. 2023.
The 12 Worst Investment Funds Over the Past Decade
This was originally posted on our Voronoi app. Download the app for free on iOS or Android and discover incredible data-driven charts from a variety of trusted sources.
In this graphic, we visualize the 12 worst investment funds over the past decade, as of Dec. 31, 2023. This ranking was compiled by Morningstar, and is based on the amount of shareholder wealth lost.
The data we used to create this graphic can also be found in the table below.
| Fund | Ticker | Category | Estimated Wealth Lost ($ billions) |
|---|---|---|---|
| iShares MSCI China ETF | MCHI | Emerging Markets | -$2.8 |
| iShares Core MSCI Emerging Markets ETF | IEMG | Emerging Markets | -$3.0 |
| ProShares Short S&P 500 | SH | Inverse Equity | -$3.2 |
| ProShares UltraShort S&P 500 | SDS | Inverse Equity | -$3.3 |
| ProShares UltraPro Short S&P 500 | SPXU | Inverse Equity | -$3.7 |
| iShares China Large-Cap ETF | FXI | Emerging Markets | -$3.7 |
| PIMCO Commodity Real Return Strat 12 | PCRPX | Commodities | -$3.8 |
| ARK Genomic Revolution ETF | ARKG | Thematic | -$4.2 |
| KraneShares CSI China Internet ETF | KWEB | Emerging Markets | -$5.9 |
| ARK Innovation ETF | ARKK | Thematic | -$7.1 |
| ProShares Ultra VIX Short-Term Futures | UVXY | Volatility | -$7.2 |
| ProShares UltraPro Short QQQ | SQQQ | Inverse Equity | -$8.5 |
From this list we can see that many of these funds are focused on emerging markets like China, or follow an “inverse equity” strategy, meaning they short their respective index.
Two noteworthy outliers are the ARK Innovation ETF and ARK Genomic Revolution ETF, which attempt to invest in “disruptive innovation”. Both ETFs are actively managed.
Shorting the U.S. Market
The U.S. stock market has experienced a long-term upward trend since 2009, meaning funds that short major indices like the S&P 500 and Nasdaq 100 have suffered over the 10-year period.
Seeing the heaviest losses is the ProShares UltraPro Short QQQ (SQQQ), which seeks daily investment results that correspond to three times the inverse (-3x) of the daily performance of the Nasdaq-100.
While these funds are likely unsuitable for a long-term buy and hold strategy, they can be profitable during downturns. One example would be the COVID-19 crash on March 12, 2020, where the S&P 500 fell by 12%.
Chinese Equities Stumble
Another common theme from this ranking are China-focused funds such as the KraneShares CSI China Internet ETF (KWEB).
Since their 2021 peak, Chinese stocks have lost over $6 trillion in market cap. This has been due to various reasons, including a sluggish COVID-19 recovery, a troubled real estate market, and alarming crackdowns on tech firms by government officials.
Want to learn more about global equity markets? Check out this graphic that visualizes the biggest companies on the Nasdaq, NYSE, and international exchanges.
-

 Markets5 days ago
Will Tesla Lose Its Spot in the Magnificent Seven?
-
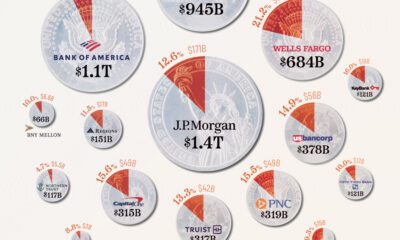
 Banks2 weeks ago
Visualizing Major U.S. Banks by Commercial Real Estate Exposure
-

 Technology2 weeks ago
Ranked: The Largest Bitcoin ETFs in the U.S.
-
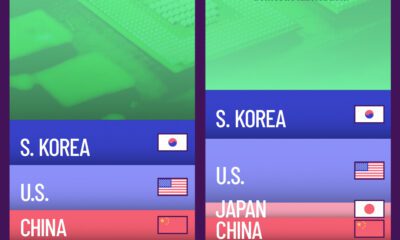
 Technology2 weeks ago
Advanced Semiconductor Market Share by Country (2023-2027F)
-

 Money2 weeks ago
Visualizing All of the U.S. Currency in Circulation
-
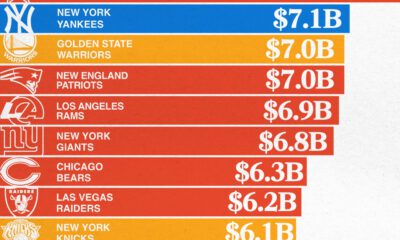
 Sports2 weeks ago
The World’s Most Valuable Sports Teams in 2024
-

 Markets1 week ago
The U.S. Banks With the Highest Exposure to Commercial Real Estate
-
 Stocks1 week ago
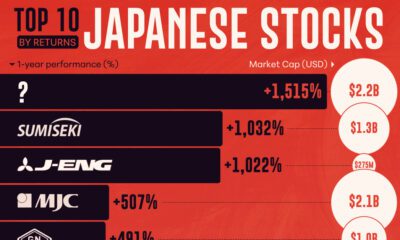
The Best Performing Japanese Stocks (1-Year Returns)